Curated OER
Graphing Favorite Colors
Third graders collect data and insert it into ClarisWorks to create a spreadsheet/graph of their favorite color. They interpret the data together.
Curated OER
Predicting Monthly Precipitation
Students should log onto, and collect data from, a specific site on the Internet. They average and compare the data using the Excel spreadsheet program, make predictions from their data, and determine the percent error of their predictions.
Curated OER
Survey and Share
Students practice collecting data by surveying other students. In this data collection lesson plan, students decide on a question and collects data from 15 other students. Eventually the students will end up graphing their results.
Curated OER
Tracks are for Trains
Second graders collect data on different forms of transportation and create a bar graph or pictograph with the information.
Curated OER
Observing Fall Migrants
Students keep a detailed data collection log of the different types of monarch behavior. They track the weather conditions daily and link it to the migration of the monarchs. They summarize their data using either a graph or a computer...
Curated OER
Bubbles
Third graders perform an experiment using different mixtures of dishwasher detergent. They construct bar graphs that record their bubble data for each detergent set.
Curated OER
RAIN
Third graders accurately measure the amount of rain in the rain gauge on a given day and create a bar graph of the data collected.
Curated OER
Hit and Run
Pupils explore data collection in this instructional activity. They investigate distance vs. time and velocity vs. time graphs using information collected with a CBR 2 to simulate the reconstruction of an accident.
Curated OER
Excel temperature Graphs
Students gather data about the weather in Nome, Alaska. In this Nome Temperature lesson, students create an excel graph to explore the weather trends in Nome. Students will find the average weather and add a trend line to their graph.
Curated OER
Farm Stories, Animal Webbing, Favorite Farm Animal Graph
Students brainstorm animals they would expect to see on a farm. They save these on a Kidspiration web. Students watch or read a farm story. They discuss the characters. Students vote for their favorite farm animal and crate a graph using...
Curated OER
Weather "Whys" Lesson 2 Seasons
Students explore seasons. In this cross curriculum weather and seasons instructional activity, students identify characteristics of the four seasons and sequence related pictures. Students listen to poems and stories about trees in...
Curated OER
Graphing
Students collect data and graph their results, then analyze the graphs. In this geometry lesson, students examine slopes and their graphs and discuss the relationship between the lines and the slopes.
Curated OER
Graphs and Measurement
Tenth graders analyze graphs and by comparing trees. In this geometry instructional activity, 10th graders investigate the use of different graphs using bar and regular graphs. They work groups at the computer.
Curated OER
Graphing Linear Equations
Ninth graders review the information that they have already learned
with regard to linear equations and graphical representations. They then assist in combining equations with a graphical element and complete various graphs with this...
Curated OER
Curve Ball
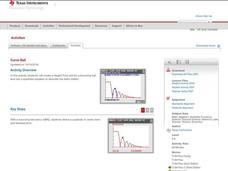
Learners explore the concept of parabolas by collecting quadratic data on a bouncing ball as it is falling using a motion detector. They plot the data and determine the equation of the quadratic in vertex form, then determine the values...
Curated OER
Walking the Plank
Eighth graders experiment with a bathroom scale, books and a plank to determine how weight readings change as distance is applied. They graph and interpret the results.
Curated OER
Math Made Easy
Students evaluate word problems. In this problem solving lesson, students are presented with word problems requiring graphing skills and students work independently to solve.
Curated OER
The M&M's Brand Chocolate Candies Counting Book
First graders use estimation skills and gather data and record their findings
Curated OER
Closing the Case
Fifth graders collect data and prepare data displays using a survey with statistical information.
Curated OER
Using the TI-GRAPH LINK
Students investigate the use of the TI-Graph Link. In this middle school mathematics lesson, students explore the transfer of data from the TI-73 to the computer and vice-versa using the TI-Graph Link.
Curated OER
A Day at the Beach
Student read Sheryl Wilson's story, "A Day at the Beach" while classifying items they find. They design a chart of the items before using educational graphing software to create a graph.
Curated OER
Scientific Investigation- Magnets
Students conduct a scientific investigation to determine if a magnet attracts paper clips through different materials. Students write out their procedures, collect data and present it in a table or chart, and analyze their results.
Curated OER
The Search for Housing Pagurus hirsutiusculus= hermit crab
Students collect snail shells, measure and record their lengths and if they are occupied by a hermit crab. They discover if their is a size difference between occupied and unoccupied shells.
Curated OER
Harry Potter Research Project
Students work together to complete a research project on Harry Potter. They write a research question and develop a survey to give to their classmates. Using the results, they create a graph and draw conclusions about the data collected.
Other popular searches
- Data Collection and Graphs
- Collect Data and Graphs
- Recording Data on Graphs
- Recording Data Into Graphs
- Data Collection Graphs

