Curated OER
Reading Bar Charts
Help kids understand how to collect data through surveys, organize data in a bar chart, then analyze their findings. There are three different surveys for learners to conduct, a full description of all the parts of a bar chart, and three...
Curated OER
Data Analysis: For Little Learners
Using pictographs, tally charts, and surveys, kids learn all about data analysis and collection. They make surveys, collect data, then construct pictographs and tally charts to organize their information.
Curated OER
Creating Tables and Bar Charts
A great way to introduce the concepts of data collection, bar charts, and data analysis. Learners see how their teacher used the data from fifty of her friends to construct a bar chart showing their favorite toys.
Curated OER
Pet Tally
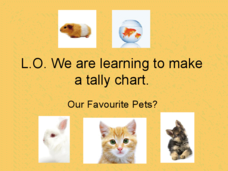
Give the class an opportunity to practice using tally marks as a way to collect data. As you progress through the slide show, learners tally up the number and types of pets they see, they then use their data to create a tally chart....
Mabry MS Blog
Scatter Plots
Scatter plots are a fun way to gather and collect relevant data. The presentation goes through several examples and then describes the different types of correlation.
Curated OER
The Biogeochemical Cycles
The majority of this presentation is a collection of diagrams and graphs that back your lecture on biogeochemical cycles. The last few slides define ecosystems and the Gaia hypothesis. You may find these slides valuable, but will...
Other
Brebeuf Jesuit Preparatory School: The Scientific Method (Part 3) [Pdf]
Explains how to collect and organize data for an experiment. Describes how to make a table and graph the data, and when to use different types of graphs. Next, it discusses which variable should be on the x- or y-axis of a graph, and how...
Other popular searches
- Data Collection and Graphs
- Collect Data and Graphs
- Recording Data on Graphs
- Recording Data Into Graphs
- Data Collection Graphs


![Brebeuf Jesuit Preparatory School: The Scientific Method (Part 3) [Pdf] PPT Brebeuf Jesuit Preparatory School: The Scientific Method (Part 3) [Pdf] PPT](https://d15y2dacu3jp90.cloudfront.net/images/attachment_defaults/resource/large/FPO-knovation.png)