Utah Education Network
Uen: Generating and Recording Data
This "fish" activity will help early elementary students develop skills related to categorizing, recording data, developing vocabulary, and counting. An assessment rubric is attached.
National Council of Teachers of Mathematics
The Math Forum: Data Collecting in the Classroom
A list of two dozen questions students can easily ask eachother in the classroom to quickly collect data in hopes of using it in their study of making graphs. Some are opinion questions, while others require the counting of certain items...
University of Georgia
University of Georgia: Inter Math: Types of Data
This site has a concise definition of "Data," plus examples of data types and collection methods.
University of South Florida
Fcat: Drops on a Penny: Teacher Notes
Students learn how to create stem-and-leaf diagrams and boxplots by collecting data on the surface tension of water molecules. This hands-on activity using pennies is a great way to learn how to organize data.
US Department of Education
Helping Your Child Learn Math: Math in the Home
An excellent compilation of activities that engage parents and children in math explorations at home. Detailed lessons covering a wide range of math topics such as fractions, measurements, money, data collection, and math in newspapers....
Better Lesson
Better Lesson: What Is Your Favorite Pet?
SWBAT create a bar graph to match a data set. SWBAT analyze the graph to find 3 pieces of information the graph shows them.
Better Lesson
Better Lesson: What Is Your Favorite Little Bear Story?
SWBAT create a bar graph to match a data set. SWBAT analyze the graph for 3 pieces of information.
Rice University
Rice University: The Hand Squeeze
Students will enjoy this data collection and class analysis experiment involving the time it takes for a hand squeeze to travel around a circle of people. From organizing the activity to collecting the data to making a table and graphing...
CK-12 Foundation
Ck 12: Matrices to Represent Data
[Free Registration/Login may be required to access all resource tools.] A collection of resources to help students understand how to use matrices to represent and manipulate data, e.g., to represent payoffs or incidence relationships in...
Rice University
Rice University: Cynthia Lanius: Let's Graph
An introduction to bar graphs, both vertical and horizontal in nature. The interactive aspect of this site allows students to change the values of the data - their favorite cafeteria foods - and then see how the graph is changed.
National Center for Ecological Analysis and Synthesis, University of California Santa Barbara
Nceas: What Are Data?
This site from NCEAS answers many questions about data. You can also learn about data, tables, and types of graphs in this informative site.
Thinkport Education
Thinkport: Algebra Ii: Inferences
Focus on the development and collection of data, emphasizing the importance of simple random sampling.
Center for Innovation in Engineering and Science Education, Stevens Institute of Technology
Ciese Real Time Data Projects: Building and Using Weather Instruments
In this lesson students will build and learn how to use three weather. They will use these instruments to collect weather data over a period of two weeks.
University of South Florida
Fcat: View Tubes: Teacher Notes
In this online activity use view tubes to collect data and determine the linear relationship and line of best fit.
Other
Alaska Sea Grant: Investigation 4 Human Impact Survey
Students examine and record data about the impact human activity has on a local aquatic environment in this teaching unit. They then analyze the information and develop a plan for improvement. The unit depends on being able to take the...
NASA
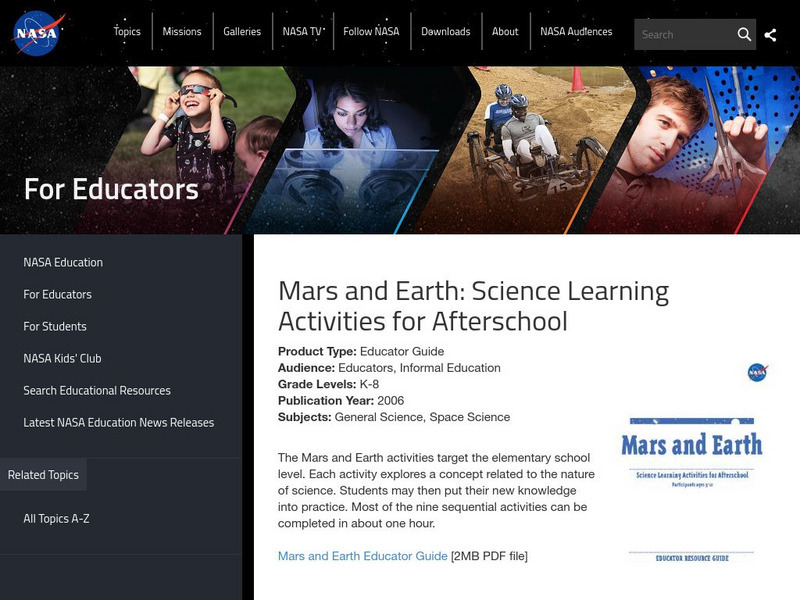
Nasa: Mars and Earth: Science Learning Activities for Afterschool
This set of activities teaches students about the big picture of science using Mars as an example: how to collect data, use evidence, and look at models.
University of California
University of California Museum of Paleontology: Understanding Science: Liquids
Students use their senses to investigate, observe, and collect data for several different liquids.
The Franklin Institute
Franklin Institute Online: Make Your Own Weather Vane
As part of a unit on gathering data about the weather, this lesson features instructions for making a simple weather vane.
Better Lesson
Better Lesson: What's in Your Name?
The students will be collecting data from other students to represent in a bar graph.
University of Texas at Austin
Mathematics Teks Toolkit: And We Go Around
Collect and display data using a bar and circle graph to explore fractions and percents.
TeachEngineering
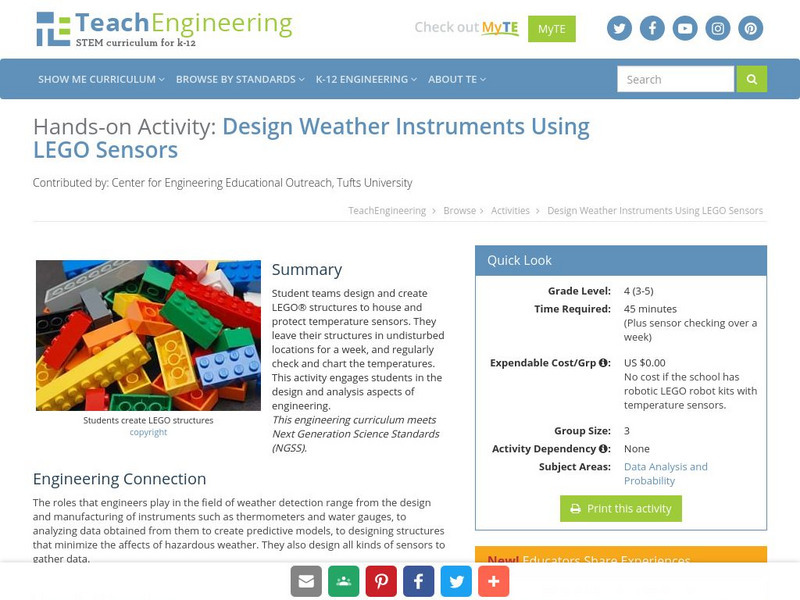
Teach Engineering: Design Weather Instruments Using Lego Sensors
Students will design and create a LEGO structure that will house and protect a temperature sensor. They will leave the structure in a safe spot and check the temperature regularly and chart it.
Utah Education Network
Uen: Weather Walks
In this multi-day, young scholars will learn weather through multisensory approaches. Students will make daily predictions. After each daily prediction, they will collect measurement and observational data by taking walks in different...
Better Lesson
Better Lesson: Line Graph Activity
Data collected is represented in tables and the students will need to choose what they want to represent in their line graph.
Other popular searches
- Collecting and Recording Data
- Data Collection Techniques
- Math Lessons Data Collection
- Data Collection Activity
- Data Collection and Median
- Data Collection and Graphs
- Data Collection Projects
- Data Collection and Analysis
- Accurate Data Collection
- Data Collection Lesson Plans
- Experimental Data Collection
- Collection of Data
