Curated OER
Data Analysis: For Little Learners
Using pictographs, tally charts, and surveys, kids learn all about data analysis and collection. They make surveys, collect data, then construct pictographs and tally charts to organize their information.
Curated OER
Reading Bar Charts
Help kids understand how to collect data through surveys, organize data in a bar chart, then analyze their findings. There are three different surveys for learners to conduct, a full description of all the parts of a bar chart, and three...
Curated OER
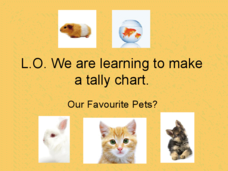
Pet Tally
Give the class an opportunity to practice using tally marks as a way to collect data. As you progress through the slide show, learners tally up the number and types of pets they see, they then use their data to create a tally chart....
Curated OER
Mrs. Lewis's Pets: Tally Mark Activity
To cute to pass up! This slide show activity has learners count the number of pets Mrs. Lewis has using tally marks. As the show progresses, kids pay attention and make a tally for each type of pet they see. Suggested uses and audio are...
Curated OER
Creating Tables and Bar Charts
A great way to introduce the concepts of data collection, bar charts, and data analysis. Learners see how their teacher used the data from fifty of her friends to construct a bar chart showing their favorite toys.
Curated OER
Probability Lesson 3
Here are a few well-thought-out discussion questions intended to accompany a probability activity. Learners consider equal chance outcomes under given situations, they investigate those outcomes by tossing a coin 30 times. They analyze...
CCSS Math Activities
Smarter Balanced Sample Items: High School Math – Claim 4
What is the appropriate model? Sample problems show the extent of the Smarter Balanced assessments Claim 4, Modeling and Data Analysis. Items provide pupils the opportunity to use mathematical modeling to arrive at a reasonable answer....
Biology Junction
Scientific Method
Break down the scientific method to get a better grasp on the proper way to use it. A short presentation walks through each step in the scientific method and the proper vocabulary associated with each. Scholars complete the worksheet to...
Mr. E. Science
The Scientific Method
The scientific method is key to implementing tests and experiments. From stating the problem to arriving at the conclusion, every scientist in the class learns the value of the method through an educational slide show presentation.
Normal Community High School
Golf Ball Lab
The first golf balls were made of wood and would only last for a few games. Modern golf balls last a lot longer but they don't float. The presentation provides the directions for a lab to determine the minimum amount of salt needed to...
Mabry MS Blog
Scatter Plots
Scatter plots are a fun way to gather and collect relevant data. The presentation goes through several examples and then describes the different types of correlation.
iCivics
Campaign Cash: Money Talks!
Money talks! And it can reveal a lot about political candidates. An 11-slide presentation examines how candidates raise and spend money on an election. The slides, using data from the 2016 Presidential election, reveal how much it costs...
Curated OER
How Do We Know About People From The Past?
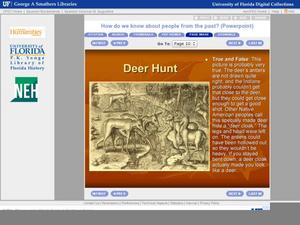
It's not enough to see or just read a primary source document; one has to analyze them fully to understand their historical implications. First learners are introduced to what primary and secondary sources are, then they read a bit of...
Mathematics Assessment Project
Modeling Motion: Rolling Cups
Connect the size of a rolling cup to the size of circle it makes. Pupils view videos of cups of different sizes rolling in a circle. Using the videos and additional data, they attempt to determine a relationship between cup...
Kenan Fellows
Using Water Chemistry as an Indicator of Stream Health
Will this water source support life? Small groups test the chemistry of the water drawn from two different sources. They then compare the collected data to acceptable levels to draw conclusions about the health of the source. The...
Curated OER
Message in a Bottle - A Satellite Journey through the Gulf Stream
The Gulf Stream has historically provided humans with a faster trade route because of its swift-moving waters. It continues to be a source of information and fascination for oceanographers today. As your class views this collection of...
National Energy Education Development Project
The Science of Energy
Did you know the word energy comes from energeia, a Greek word? Introduce learners to the four types of potential energy, five types of kinetic energy, and energy transformation with a presentation about where we get our energy and...
Curated OER
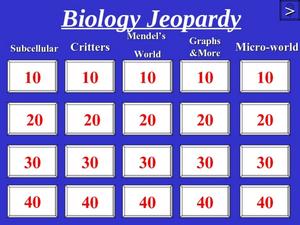
Biology Jeopardy
Play Jeopardy as you review what might possibly be an entire year's high school biology course! The vast variety of questions requires that you read through the slides to make sure that they all relate to your curriculum. You could make...
Biology Junction
Mendelian Genetics
Over the course of seven years, Gregor Mendel grew more than 28,000 pea plants. The large amount of data he collected led him to postulate the rules of genetics as we understand them today. Scholars learn about Mendel, genetics, and...
Curated OER
The Biogeochemical Cycles
The majority of this presentation is a collection of diagrams and graphs that back your lecture on biogeochemical cycles. The last few slides define ecosystems and the Gaia hypothesis. You may find these slides valuable, but will...
Teach Engineering
Show Me the Money
Class members learn how to estimate the total costs involved to design and build a bridge by including design, material, equipment, and labor costs. The activity includes a discussion about the trade-off between cost and aesthetics.
Curated OER
Chalkboard Challenge: 5th Grade Math Review
This math review PowerPoint engages fifth grade students in an interactive review of math concepts. This review game includes questions on numeration, data interpretation and number theory. This is in a "Jeopardy" style format.
Kenan Fellows
Determining Stream Health by the Diversity and Types of Benthic Organisms
How diverse are the benthic organisms found in local streams? Using the information learned in previous lessons on identification of macroinvertebrates and on calculating stream index values, groups determine the health of local...
DataWorks
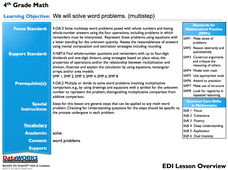
4th Grade Math: Multi-Step Word Problems
Solving word problems requires reading comprehension and math computation. Through an interactive slideshow presentation, fourth graders observe and follow each step toward solve multiplication and division word problems.
Other popular searches
- Collecting and Recording Data
- Data Collection Techniques
- Math Lessons Data Collection
- Data Collection Activity
- Data Collection and Median
- Data Collection and Graphs
- Data Collection Projects
- Data Collection and Analysis
- Accurate Data Collection
- Data Collection Lesson Plans
- Experimental Data Collection
- Collection of Data


