Other
U. Of Wisconsin: Formulating Statistical Questions and Collecting Data
This slideshow gives a detailed explanation of the characteristics of statistical questions and how they differ from other types of questions, the types of studies, and the methods for collecting data. It describes the case of Clever...
Sophia Learning
Sophia: Why Collect Data: Lesson 2
This lesson will discuss and explain why we collect data. It is 2 of 5 in the series titled "Why Collect Data."
Sophia Learning
Sophia: Why Collect Data: Lesson 3
This lesson will discuss and explain why we collect data. It is 3 of 5 in the series titled "Why Collect Data."
Centers for Disease Control and Prevention
Centers for Disease Control: Survey and Data Collection
Site contains statistical data for the National Center for Health Statistics.
Sophia Learning
Sophia: Continuous Data Tutorial
Continuous data is defined and explained in this video.
Sophia Learning
Sophia: Continuous Data
Continuous data is defined and examples are given in this lesson.
Sophia Learning
Sophia: Discrete Data
Explore the term discrete data and look at examples for further explanation.
Other
Brebeuf Jesuit Preparatory School: The Scientific Method (Part 3) [Pdf]
Explains how to collect and organize data for an experiment. Describes how to make a table and graph the data, and when to use different types of graphs. Next, it discusses which variable should be on the x- or y-axis of a graph, and how...
Rice University
Rice University: Cynthia Lanius: Let's Graph
An introduction to bar graphs, both vertical and horizontal in nature. The interactive aspect of this site allows students to change the values of the data - their favorite cafeteria foods - and then see how the graph is changed.
Other
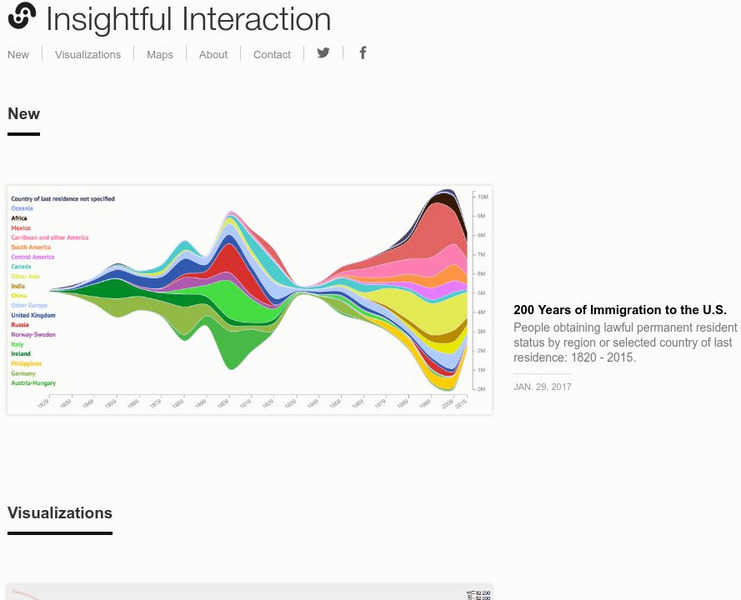
Insightful Interaction: Visualizations
A collection of interactive visualizations that were produced through analysis of economic, political, and market research data. Topics are diverse, e.g., military spending and trade, immigration, consumer spending, crime, unemployment,...
NASA
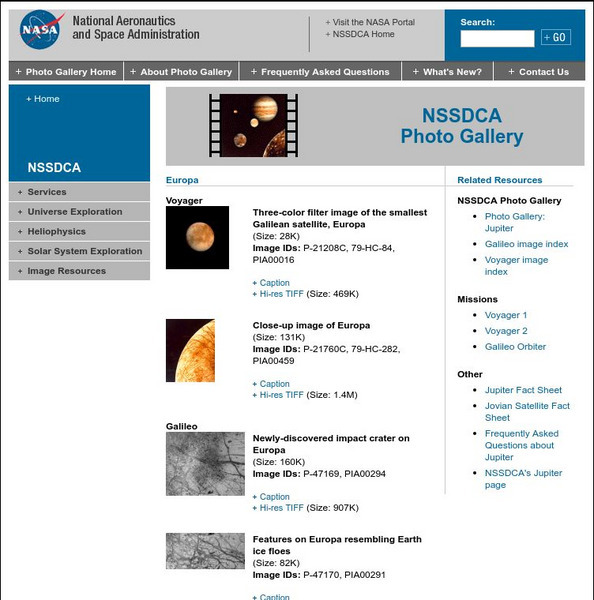
Nasa Space Science Data Archive: Photo Gallery: Europa
This NASA page is a collection of thumbnail images of Europa taken by the Voyager and Galileo missions. Thumbnails link to low and high resolution image files and complete caption files. Images are excellent examples of various surface...
Other
Visible Geology: Stereonet
A lower hemisphere graph for the placement of geological data is called a stereonet. This site allows students to plot data on their own stereonet(s).
NASA
Nasa Space Science Data Archive: Mercury From Mariner 10, Degas Crater
Single image mosaic from NSSCD Mariner 10 collection. Shows detail of an impact basin with typical ray structures. Thumbnail image links to large graphic file with more detail.
NASA
Nasa Space Science Data Archive: Photo Gallery: Mars
A huge collection of pictures of Mars, including shots from spacecraft and landers. Extensive coverage of controversial features like the "face on Mars" with comparison photos from Viking and Mars Global Surveyor.
The Washington Post
Washington Post: Mapping America's Wicked Weather and Deadly Disasters
Features data collection for natural disasters and maps the trends giving us an idea of where disasters have a tendency to strike.
Other
Forbes: Migration Map
Enter a county or major city to see the inbound and outbound migration data. This map visualizes migration data from the years 2005-2010 that the IRS has collected. In order to preserve privacy, the IRS only includes moves that more than...
PBS
Pbs Learning Media: Documenting Glacial Change
This collection of comparative glacier images adapted from the National Snow and Ice Data Center shows substantial changes in five Alaskan glacier positions over periods of 60 to 100 years.
PBS
Pbs Learning Media: Link Between Arctic Sea Ice and Solar Radiation Absorbed
The Arctic plays an important role in regulating Earth's climate. The region reflects much of the Sun's energy and helps keep the planet cool. Data collected by NASA have revealed that sea ice in the Arctic has steadily declined over the...
Curated OER
Cell Biology: Online Onion Root Tips
Online mitosis activity offers the student the opportunity to identify, classify, calculate, and graph the phases of mitosis. Explanations of each phase, actual cells are displayed for classifing and gathering data in this comprehensive...
Curated OER
Scholastic: Weather Watch
Scholastic presents Weather Watch, where you can learn to predict the weather. Learn how to observe clouds, collect data with weather tools, investigate climate conditions, and analyze the weather. The site includes a comprehensive...
Curated OER
Sundial Image
This resource provides all the directions and worksheets necessary to make a sundial and record data with it.
Curated OER
Fill It Up
An excellent compilation of activities that engage parents and children in math explorations at home. Detailed lessons covering a wide range of math topics such as fractions, measurements, money, data collection, and math in newspapers....
Other popular searches
- Collecting and Recording Data
- Data Collection Techniques
- Math Lessons Data Collection
- Data Collection Activity
- Data Collection and Median
- Data Collection and Graphs
- Data Collection Projects
- Data Collection and Analysis
- Accurate Data Collection
- Data Collection Lesson Plans
- Experimental Data Collection
- Collection of Data


