Texas Education Agency
Texas Gateway: Collecting Data and Making Predictions
Given an experimental situation, the student will write linear functions that provide a reasonable fit to data to estimate the solutions and make predictions.
Discovery Education
Discovery Education: Science Fair Central: Investigation Set Up and Collect Data
A brief overview of how to gather both quantitative and qualitative data, complete with a sample data table.
PBS
Pbs Kids Afterschool Adventure!: Operation: Data Saves the Day Activity Plan
Data comes to the rescue! Children will collect, analyze, and represent data as they try to dodge a series of catastrophes faced by characters from their favorite PBS Kids shows.
Oswego City School District
Regents Exam Prep Center: Displaying Data
Use this lesson, practice exercise, and teacher resource in planning instruction on displaying data. In the lessons, you'll find definitions and examples of ways to collect and organize data, quartiles, and box-and-whisker plots, as well...
Oswego City School District
Regents Exam Prep Center: Multiple Choice Practice: Working With Data
Test your knowledge of working with data by taking this twenty question multiple-choice practice test. Use a graphing calculator to help with any graphing problems and check your answers at any given time throughout the test.
Illustrative Mathematics
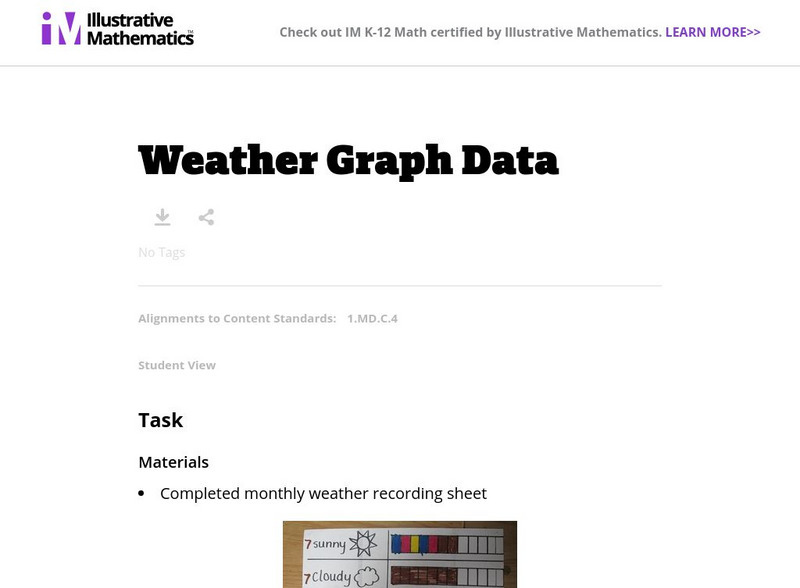
Illustrative Mathematics: Weather Graph Data
The purpose of this task is for students to represent and interpret weather data, as well as answer questions about the data they have recorded. Student worksheets and recording sheet are included.
NASA
Nasa: Precipitation Towers: Modeling Weather Data
This instructional activity uses stacking cubes as a way to graph precipitation data, comparing the precipitation averages and seasonal patterns for several locations. Variations on the instructional activity can accommodate various ages...
University of Texas
Inside Mathematics: Parking Cars [Pdf]
This task challenges a student to use their understanding of scale to read and interpret data in a bar graph.
NOAA
Noaa: Estuaries 101 Curriculum: Seasonal Swings
Students use an interactive map to compare environmental conditions in different estuaries around the National Estuarine Research Reserve System. A second activity allows students to use the Graphing Tool to find, select, and graph data...
Better Lesson
Better Lesson: Changing Matter:changing Matter: Is Weight the Same or Different?
Students conduct a hands-on investigation to determine how matter, changing state, effects the property of weight. Students will collect data and graph their results. Resources include step by step instructions, a data worksheet, videos...
CPALMS
Cpalms: Dollars for Density
This is a guided inquiry activity in which students use simple lab procedures and discussions to develop and apply the concept of density. Students collect and graph data which they use to explore the relationship between mass and...
Science Buddies
Science Buddies: An Experiment in Visual Perception
Graphical methods of data presentation are a key feature of scientific communication. This project will get you thinking about how to find the best way to communicate scientific information.
Annenberg Foundation
Annenberg Learner: Journey North: Gray Whale Migration Study
Follow gray whales as they make their long journey from Mexico to their feeding grounds in the Arctic. This webpage gives students background information and up to date news about the migration of the gray whales. Also, students can...
Math Drills
Math Drills: Statistics and Probability Worksheets
Download these free worksheets to sharpen your skills with statistics and probability. Sheets focus on collecting and organizing data, measures of central tendency (mean, median, mode, and range), and probability.
Discovery Education
Discovery Education: Comparing Countries
Excellent instructional activity in which students make predictions and collect information about the United States, China, and the Democratic Republic of Congo. After collecting data, students compare the information and create graphs...
Other
42e Xplore: Statistics and Probability
An extensive collection of links on statistics and probability can be found here! Discussions ranging from the basics of stats through more complex data analysis. Topics are broken down into sections for teachers, students, WebQuest...
PBS
Pbs Teachers: Escape! Because Accidents Happen: Car Crash
Examine the benefits and risks of using seat belts and analyze national statistics on seat belt use. Design and implement a study of local seat belt use and compare the results to the national statistics.
TeachEngineering
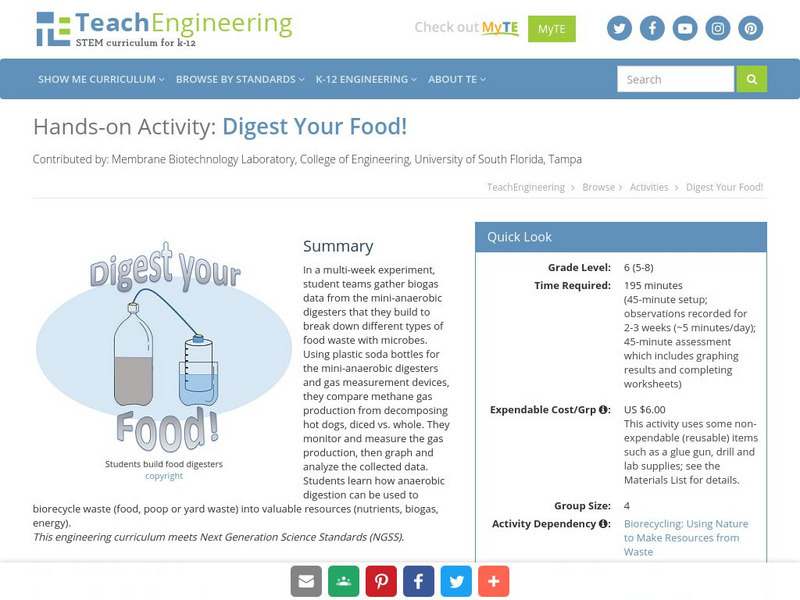
Teach Engineering: Digest Your Food!
In a multi-week experiment, student teams gather biogas data from the mini-anaerobic digesters that they build to break down different types of food waste with microbes. They compare methane gas production from decomposing hot dogs,...
US Geological Survey
U.s. Geological Survey: The "1 Oo Year Flood"
Fact sheet uses graphs to highlight streamflow data collected after major floods.


