National Council of Teachers of Mathematics
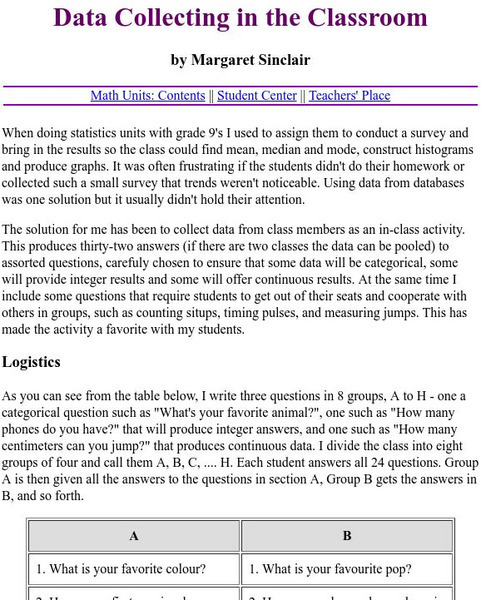
The Math Forum: Data Collecting in the Classroom
A list of two dozen questions students can easily ask eachother in the classroom to quickly collect data in hopes of using it in their study of making graphs. Some are opinion questions, while others require the counting of certain items...
Better Lesson
Better Lesson: What Is Your Favorite Pet?
SWBAT create a bar graph to match a data set. SWBAT analyze the graph to find 3 pieces of information the graph shows them.
Better Lesson
Better Lesson: What Is Your Favorite Little Bear Story?
SWBAT create a bar graph to match a data set. SWBAT analyze the graph for 3 pieces of information.
University of Texas at Austin
Mathematics Teks Toolkit: And We Go Around
Collect and display data using a bar and circle graph to explore fractions and percents.
Better Lesson
Better Lesson: Line Graph Activity
Data collected is represented in tables and the students will need to choose what they want to represent in their line graph.
Khan Academy
Khan Academy: Picture Graphs (Pictographs) Review
Picture graphs are a fun way to display data. This article reviews how to create and read picture graphs (also called pictographs).
McGraw Hill
Glencoe Mathematics: Online Study Tools: Histograms
This site gives a short interactive quiz which allows students to self-assess their understanding of the concept of histograms.
Science and Mathematics Initiative for Learning Enhancement (SMILE)
Smile: Apples a Peel to Me
This lesson plan helps children understand how to graph data by using both real objects, apples, and pictures of apples. Great activity for a variety of themes.
University of Illinois
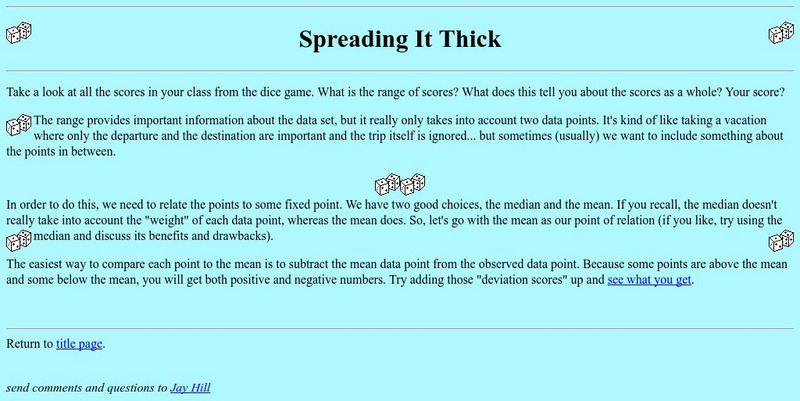
University of Illinois: Spreading It Thick
Resource contains the definition for variance. It also shows students how to calculate the variance. There is a link to a bar graph that displays variance for the data example.
Khan Academy
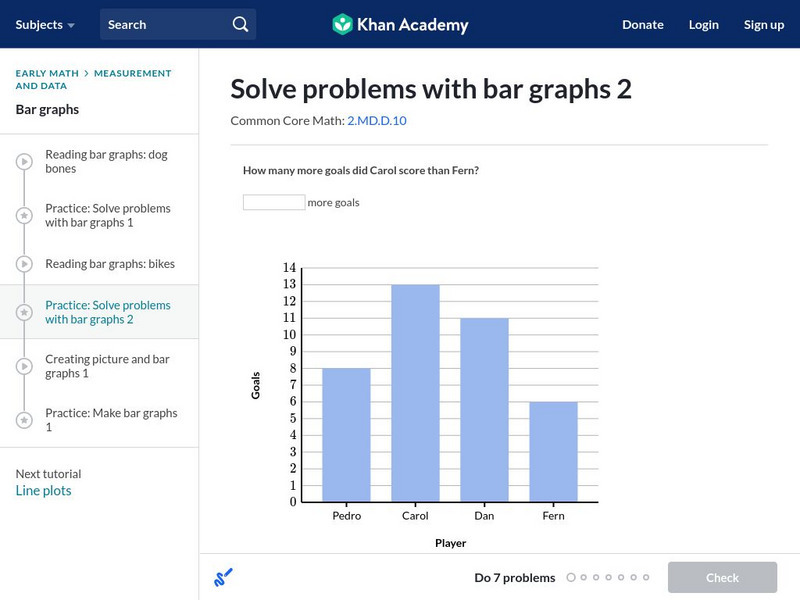
Khan Academy: Solve Problems With Bar Graphs 2
Use bar graphs to solve addition and subtraction word problems. Students receive immediate feedback and have the opportunity to try questions repeatedly, watch a tutorial video, or receive hints.
Visual Fractions
Visual Fractions: Identify With Lines
Use this interactive site from Visual Fractions to practice identifying numerators and denominators using a number line. You will be given a point between 0 and 1 to name as a fraction.
Other popular searches
- Data Display
- Misleading Data Display
- Appropriate Data Display
- Graphs and Data Display
- Display Simple Data
- Analyze Data Displays
- Data Display Center
- Voluntary Data Display
- Best Data Display
- Rates and Data Display
- Simulation Data Display
- Ways to Display Data


