Hi, what do you want to do?
University of Washington
Institute for Health Metrics and Evaluation : Gbd Compare
Impressive visualization of the causes of death in every country around the world. You can choose to have the data displayed in different chart forms.
NOAA
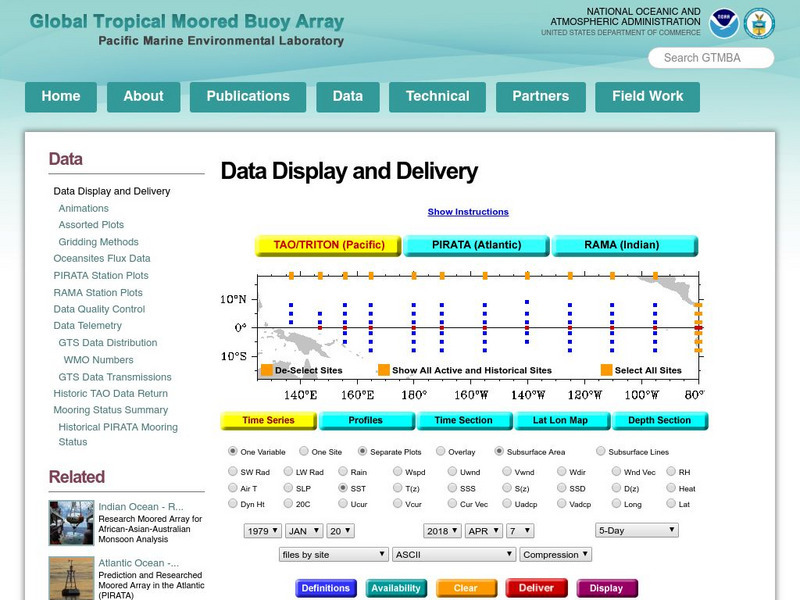
Noaa: Pmel: Tropical Atmosphere Ocean Project: Tao/triton Data Display
Resource features real-time data from moored ocean buoys for improved detection, understanding, and prediction of El Nino and La Nina with diagrams.
Other
Ifip: Information and Communications Technologies in Latin America [Pdf]
The content of a slideshow presentation on the state of computer technology integration in Latin American countries in the public and private sectors. Charts display data relating income levels with computer ownership, mobile phone use,...
Federal Trade Commission
Federal Trade Commission: Infographic: Equifax Data Breach Settlement
Infographic displays information about the Equifax data breach settlement that provided up to $425 million to help people affected by the data breach.
NOAA
Noaa: Global Monsoons
This interactive world map allows you to view factors associated with monsoons. Monsoon data displayed includes factors such as precipitation, wind speed, soil moisture, and ocean temperatures. Links to monsoons associated with specific...
US Geological Survey
Usgs: Water Quality of San Francisco Bay
This resource from the United State Geological Survey provides data about San Francisco Bay's water quality. Data is displayed in time series plots, vertical profiles, longitudinal sections, space and time contours, and x-y scatter plots.


