National Council of Teachers of Mathematics
Eruptions: Old Faithful Geyser
How long do we have to wait? Given several days of times between eruptions of Old Faithful, learners create a graphical representation for two days. Groups combine their data to determine an appropriate wait time between eruptions.
Curated OER
Button Bonanza
Collections of data represented in stem and leaf plots are organized by young statisticians as they embark some math engaging activities.
Illustrative Mathematics
Puzzle Times
Give your mathematicians this set of data and have them create a dot plot, then find mean and median. They are asked to question the values of the mean and median and decide why they are not equal. Have learners write their answers or...
Illustrative Mathematics
Puppy Weights
Nobody can say no to puppies, so lets use them in math! Your learners will take puppy birth weights and organize them into different graphs. They can do a variety of different graphs and detail into the problem based on your classroom...
Curated OER
Reel Projects
Students investigate projectile motion. In this projectile motion lesson, students investigate a website with an interactive lesson. Students view the changes in the projectile they see in the lesson. Students watch short video clips and...
Texas Instruments
Texas Instruments: Describing One Variable Data
Students sort data and display it graphically using various plots. They also get familiarized with statistical concepts like measures of spread and central tendency.
Beacon Learning Center
Beacon Learning Center: How It All Stacks Up
The resource examines how to use bar graphs to organize and display data.
Beacon Learning Center
Beacon Learning Center: Kids Have Pets
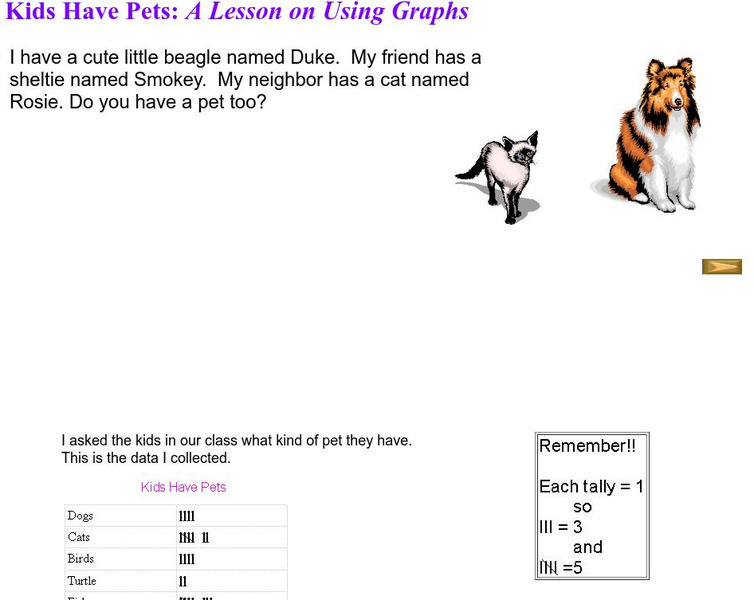
The activity investigates bar graphs. Students complete a lesson using graphs to examine pets.
Beacon Learning Center
Beacon Learning Center: I Am Special
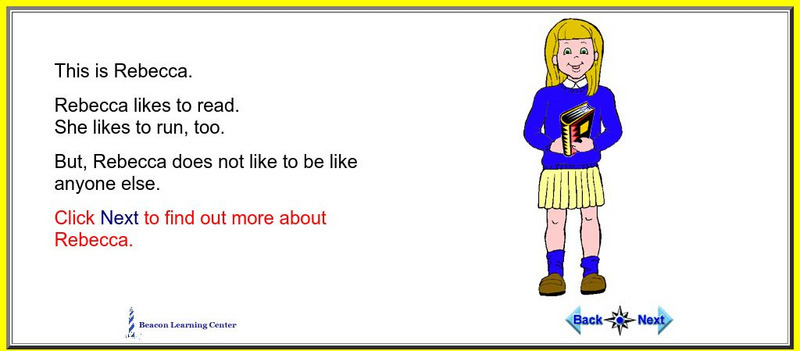
The activity investigates picture graphs. Learn about Rebecca through picture graphs.
Beacon Learning Center
Beacon Learning Center: All the Parts
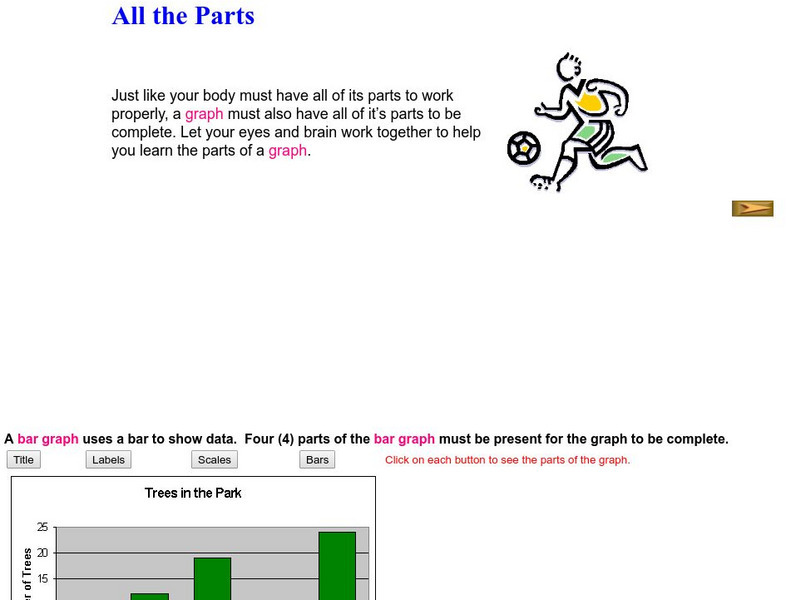
The activity investigates bar graphs. Students learn about all the parts of a graph.


