University of Georgia
University of Georgia: Inter Math: Types of Data
This site has a concise definition of "Data," plus examples of data types and collection methods.
PBS
Pbs Learning Media: Graphs, Charts, and Tables: Targeted Math Instruction
At the end of this lesson about graphs, charts, and tables, students will be able to interpret and compare data from graphs (including circle, bar, and line graphs), charts, and tables.
Sophia Learning
Sophia: Using Graphs to Analyze Data
This lesson will demonstrate how to analyze and interpret data given in the form of a graph.
Web Elements
Web Elements Periodic Table: Phosphorous
Very nicely organized WebElements site with basic data and information on phosphorous, along with good graphics and a sumary of the isolation processes used.
National Center for Ecological Analysis and Synthesis, University of California Santa Barbara
Nceas: What Are Data?
This site from NCEAS answers many questions about data. You can also learn about data, tables, and types of graphs in this informative site.
Other
Tulpehocken Area School District: Graphing and Analyzing Scientific Data
Student learning exercise with explanation of pie, bar, and line graphs, the parts of a graph, and the definition of mean, median, and mode. This summary is followed by an exercise for each type of graph within a scientific context.
Khan Academy
Khan Academy: Picture Graphs (Pictographs) Review
Picture graphs are a fun way to display data. This article reviews how to create and read picture graphs (also called pictographs).
Web Elements
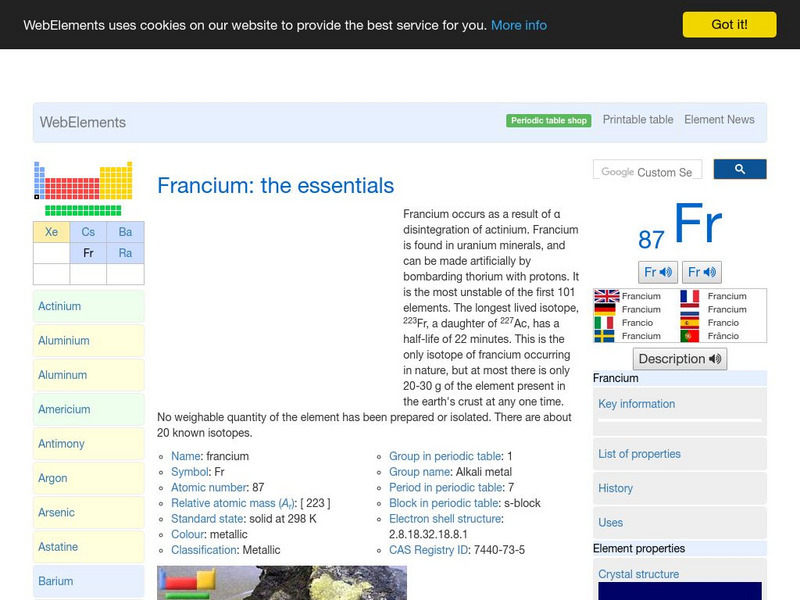
Web Elements Periodic Table: Francium
Webelements offers a nicely written summary of what is known about this rare element francium, along with basic data.
University of Texas at Austin
Mathematics Teks Toolkit: And We Go Around
Collect and display data using a bar and circle graph to explore fractions and percents.
Rice University
Rice University: The Hand Squeeze
Students will enjoy this data collection and class analysis experiment involving the time it takes for a hand squeeze to travel around a circle of people. From organizing the activity to collecting the data to making a table and graphing...
Cuemath
Cuemath: Histograms
A comprehensive guide for learning all about histograms with definitions, solved examples, and practice questions.
Cuemath
Cuemath: Stem and Leaf Plot
A comprehensive guide for learning all about stem and leaf plots with definitions, how to construct them, solved examples, and practice questions.
Cuemath
Cuemath: Outlier
A comprehensive guide for exploring the topic of outliers with definitions, what is an outlier, how to find outliers using the turkey method and the interquartile range, solved examples, and interactive questions.
Florida-Spectrum Environmental Services
Florida Spectrum: Chemical Fact Sheet: Indium
This site provides a fact sheet with information on the basic data and properties of Indium. It also includes some of its uses.
Florida-Spectrum Environmental Services
Florida Spectrum: Chemical Fact Sheet: Francium
This site provides a fact sheet with information on the basic data and properties of Francium. It also includes some of its uses.
Better Lesson
Better Lesson: Line Graph Activity
Data collected is represented in tables and the students will need to choose what they want to represent in their line graph.
Illustrative Mathematics
Illustrative Mathematics: Color Week
Five-year-olds need to count things that relate to them. This activity builds on their need to be included or see the relevance of their counting. Students will practice counting, writing numbers, and filling in a chart or bar graph....
BBC
Bbc: Prehistoric Life: Cavemen
One page general information of A. robustus and A. boisei that accompanies the BBC series "Ape-Man". Includes a photo, a data table summary, and a shockwave video outlining anatomical details. Archived.
PBS
Pbs: Toothpicks: Patterns in Geometric Shapes
How can you describe the pattern made by a growing triangular shape? This interactive exercise focuses on using what you know about pattern recognition and completing a table so you have data you can use to graph the coordinates on a...


