Curated OER
Pumpkin Seed Experiment
In this unique lesson students participate in a pumpkin seed experiment. Students interact with the pumpkins weight, seeds and record their findings of what lies within the pumpkin once the top of the pumpkin is cut off for observations....
Curated OER
Lab Sheet: Exponential Growth and Decay
In this exponential worksheet, students gather information from an experiment and plot the data in a scatter plot. Using given formulas, they plot an equation of a line and then compare the graphs. Students observe exponential growth...
Curated OER
Jumping in the Air - What was your Height?
Students solve equations using the quadratic formula. In this quadratic equations lesson, students use digital cameras to film students jumping and import film clips into a computer. Students use the data in the quadratic formula...
Curated OER
Linear Functions
Students solve and graph linear equations. In this algebra activity, students collect data and plot it to create a linear function. They identify the domain and range of each line.
Curated OER
Building Storm Shelters
Sixth graders explore area and perimeter. In this online interactive area and perimeter lesson, 6th graders investigate why the perimeter of rectangles can vary considerably even when the area is held constant. Students construct...
Curated OER
Favorite Farm Animals
Students perform a study of farm animals and their babies. They compile a graph of their favorite farm animals. They utilize a spreadsheet worksheet which is imbedded in this plan.
Curated OER
Little Red Corvette
Students investigate the acceleration of a car. In this acceleration of a car lesson, students make a scatter plot of corvette acceleration data. Students find a model to fit the data by taking the integral of the curve created by the...
Curated OER
Understanding Equations of Functions
Students write equations for different functions. In this algebra lesson, students observe data and find the function that goes along with that data. The identify the line of best fit.
Curated OER
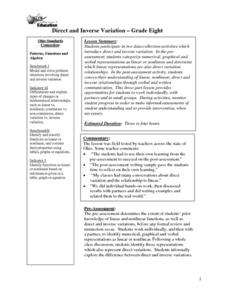
Direct and Inverse Variation
Eighth graders participate in two data collection activities that involve direct and inverse variation. In the pre-assessment, 8th graders categorize numerical, graphical, and verbal representations as linear or nonlinear and determine...
Curated OER
Design-A-Room Project (Part 3 of 3)
Learners culminate a unit on measurement with a focus on area and perimeter. They design a floor plan of their dream room on graph paper showing the proper area and perimeter. They plan the budget for their room and make a 3-D scale...
Curated OER
Making Connections
Seventh graders relate patterns with higher math. In this 7th grade math lesson, 7th graders analyze different methods of portraying data. They relate the data to real life scenarios.
Curated OER
The Box Problem
Students create graphic, algebraic and verbal ideas of functions. In this algebra lesson, students graph functions and identify the zeros of the functions. They find the domain and range and classify functions as relation or not.
Curated OER
Arrange the Classroom (Part 1 of 3)
Fifth graders arrange the classroom using all the moveable objects and through the exploration of area and perimeter. They determine the area of the classroom, create and label model pieces of furniture using graph paper, and create a...
Curated OER
Penny Toss - Exponential Growth and Decay
In this penny toss worksheet, students collect statistical data by tossing pennies and then create a scatter plot of the data. They use formulas for exponential growth and decay and then plot the function. This two-page document...
Curated OER
Food Groups in our Lunch
Students make a graph. In this food groups and graphing lesson, students pack a sack lunch and then work in groups to tally the number of foods from each food group that they have. Students use the data collected to create a graph using...
Curated OER
Introduction to Polynomials
Students analyze the graphs of polynomial functions, examine vocabulary associated with polynomials, and determine the maximum number of real roots possible for a polynomial
Curated OER
Trends of Snow Cover and Temperature in Alaska
Students compare NASA satellite data observations with student surface measurements of snow cover and temperature. They practice data collection, data correlations, and making scientific predictions.
Curated OER
A Look at Race in America Using Statistics
Eleventh graders explore the issue of racism in America. In this American History instructional activity, 11th graders analyze charts and graphs on blacks and whites in America.
Curated OER
Let's Flip a Coin
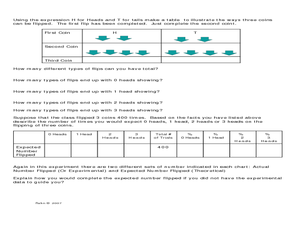
In this probability worksheet, students use a TI graphing calculator to simulate flipping a coin and compare their results (experimental probability) to the expected results (theoretical probability). The five page worksheet contains...
Curated OER
Water in the Texas Coastal Basins
High schoolers, after researching a Texas coastal basin, map and graph the information they collect and then translate it into a short report to be presented to their classmates. They brainstorm unique ways to maintain Texas estuaries as...
Curated OER
Earthquakes
Eighth graders demonstrate the mathematical components of a scientific problem as well as illustrate how real world problems can be solved using math. They demonstrate math skills such as rate calculation, graphing, and linear equations.
Curated OER
Doing The School Run
Students explore finding the percent of a numbers. They survey their peers to determine modes of transportation used in getting to school. Afterward, students organize information and create graphs and charts. They explore alternative...
Curated OER
Choose or Lose: The Electoral Process
Pupils examine the local and national election process. In groups, they brainstorm a list of the issues important to them and compare them to an overall list of issues present in the election. They analyze graphs and complete...
Curated OER
Tracking Your Favorite Web Sites
Ninth graders track the hit count on their favorite web sites. In this Algebra I instructional activity, 9th graders record the number of hits on their favorite web site for twenty days. Students explore the data to determine if the...


