Khan Academy
Khan Academy: Splitting Data Into Related Tables
See how data distributed across multiple tables are related to each other in some way.
Yale University
Yale University: Categorical Data Examples
Site provides some different examples of categorical data and discusses the use of two-way tables.
Texas Instruments
Texas Instruments: Describing Categorical Data
Learners analyze the distribution of categorical data. They calculate percents and visually compare the data sets with a bar chart.
Texas Instruments
Texas Instruments: Comparing Distributions of Univariate Data
Students compare univariate data distributions using statistical concepts like box plots, stem plots, and histograms.
Khan Academy
Khan Academy: Effects of Shifting, Adding, & Removing a Data Point
Practice figuring out how the mean and median are affected when a data point is added to, taken from, or shifted within a data set. Students receive immediate feedback and have the opportunity to try questions repeatedly, watch a video...
Texas Instruments
Texas Instruments: Special Cases of Normally Distributed Data
Students perform single and two-sample t procedures to investigate special cases of normally distributed data. They explore inference for a least-square regression line, including the confidence interval.
CK-12 Foundation
Ck 12: Statistics: Grouped Data to Find the Mean
[Free Registration/Login may be required to access all resource tools.] Covers frequency distribution tables with grouped data.
CK-12 Foundation
Ck 12: Statistics: Standard Deviation of a Data Set
[Free Registration/Login may be required to access all resource tools.] Learn about standard deviation of normally distributed data.
Texas Education Agency
Texas Gateway: Evaluating Methods of Sampling From a Set of Data
Given a problem situation, the student will evaluate a method of sampling to determine the validity of an inference made from the set of data.
Other
Online Statistics Education: Graphing Distributions [Pdf]
This is the second chapter of a statistics e-text developed collaboratively by Rice University, University of Houston Clear Lake, and Tufts University. It looks at many different types of data displays and the advantages and...
CK-12 Foundation
Ck 12: Statistics: Basic Graph Types
[Free Registration/Login may be required to access all resource tools.] Organize distributions of data by using a number of different methods.
Science Education Resource Center at Carleton College
Serc: Mn Step: Statistical Analysis of Lincoln
For this activity, students first work in groups to collect information about a set of pennies. They measure and record the mass for each one in a table using a spreadsheet program if possible. They also record its year and, for 1982...
Texas Instruments
Texas Instruments: Frequency Data
Student activity for developing vocabulary with respect to frequency of data represented in various forms.
Texas Education Agency
Texas Gateway: Tea Statistics: Discrete Distribution (Playing Card Experiment)
In this Stats lab, students will work with a set of playing cards and a calculator. They will compare empirical data and a theoretical distribution to determine if an everyday experiment fits a discrete distribution. They will compare a...
CK-12 Foundation
Ck 12: Statistics: Ungrouped Data to Find the Mean
[Free Registration/Login may be required to access all resource tools.] Covers frequency distribution tables with ungrouped data.
CK-12 Foundation
Ck 12: Statistics: Variance of a Data Set
[Free Registration/Login may be required to access all resource tools.] Covers the variance for a normally distributed random variable.
Columbia University
Nasa: Sedac: Population Distribution and Change
[Free Registration/Login Required] A collection of forty-nine data sets from SEDAC (Socioeconomic Data and Applications Center) that examine the distribution of human populations around the world and the changes that have taken place in...
Mangahigh
Mangahigh: Data: Use Frequency Tables
This site provides students practice with the concept of frequency tables. Students can learn about the topic by completing an interactive tutorial. Students can then take a ten question timed test to practice the skill.
Mangahigh
Mangahigh: Data: Find the Class Interval Containing the Mode
Students watch an online tutorial on the concept of finding mode from a frequency table. After watching, students test their knowledge by attempting ten practice problems that increase or decrease in difficulty based on their answers.
Mangahigh
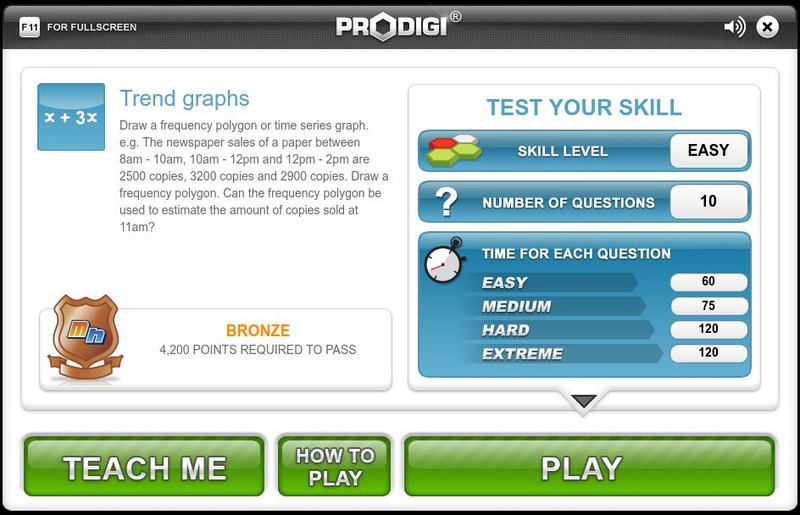
Mangahigh: Data: Trend Graphs
Students explore the concept of frequency trend graphs by working through an online tutorial and then attempting a ten question quiz that increases in difficulty as questions are answered correctly.
Texas Instruments
Texas Instruments: The Normal Distribution
Students graph normal distributions, shade desired areas, and find related probabilities. They graph Normal probability scatter plots to check the normal (linear) shape of a data distribution.
PBS
Pbs Learning Media: Restocking Shoes
In this video from Cyberchase, Bianca uses data on past shoe sales to help her decide what quantities of each size she should order in the next shipment.
California State University
Cal State San Bernardino: Bivariate Distribution Applet
The applet is a target at which green darts are shot either with a strict correlation to each other or without -- the user defines this. A good example of how bivariate data is truly influenced by two variables, possibly dependent upon...
Science Education Resource Center at Carleton College
Serc: Reasoning About Center and Spread: How Do Students Spend Their Time?
Using their own habits for data, students predict how much time they spend on different activities each day, and how much variability each activity is likely to have. They then collect data into a class spreadsheet and look at the...


![Online Statistics Education: Graphing Distributions [Pdf] eBook Online Statistics Education: Graphing Distributions [Pdf] eBook](https://d15y2dacu3jp90.cloudfront.net/images/attachment_defaults/resource/large/FPO-knovation.png)
