Texas Instruments
Texas Instruments: Summarizing Distributions of Univariate Data
Students understand statistical concepts like center of data and the amount of data variation from the center. They calculate the measures of the center of a distribution and the measures of spread for the data collected as a list....
Texas Instruments
Texas Instruments: Distributions and Univariate Data
This set contains statistics questions comparing distributions of univariate data. The student is asked to note the differences between distributions regarding center, shape, spread, and existence of outliers.
Illustrative Mathematics
Illustrative Mathematics: S Id.4 Do You Fit in This Car?
Students are tasked with solving a common issue for automobile manufacturers that require the students to use normal distribution as a model for data distribution. They will also use mean and standard deviation to figure out the problem....
Annenberg Foundation
Annenberg Learner: Making a Stem and Leaf Plot
A line plot may not be a useful graph for investigating variation so we must come up with a new representation based on groups of data. Construct a stem and leaf plot from a set of 26 data values.
National Council of Teachers of Mathematics
Nctm: Illuminations: Histogram Tool
This tool can be used to create a histogram for analyzing the distribution of a data set using data that you enter or using pre-loaded data that you select.
Khan Academy
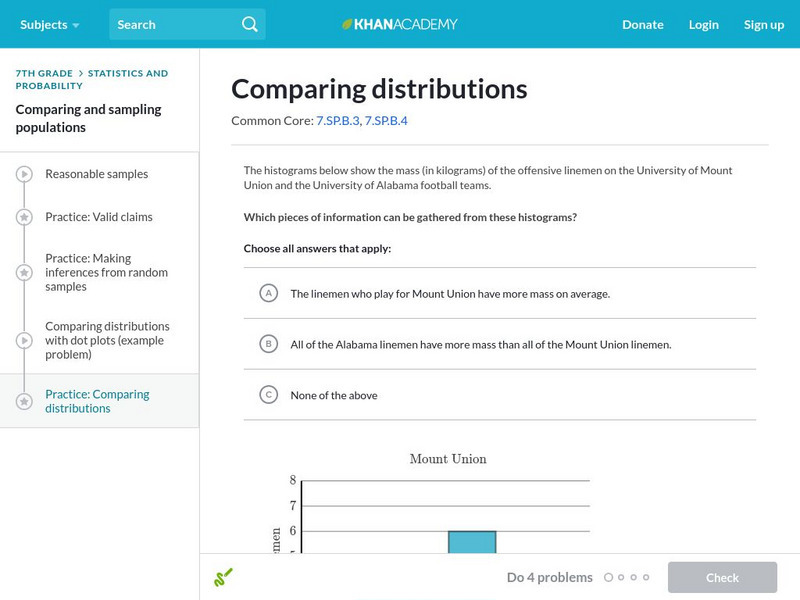
Khan Academy: Comparing Distributions
Practice comparing distributions that are presented in dot plots, histograms, and box plots. Students receive immediate feedback and have the opportunity to try questions repeatedly, watch a video or receive hints.
Science Struck
Science Struck: Types of Skewed Distribution With Real Life Examples
Explains what is meant by a skewed distribution, describes the two types, and gives examples.
National Snow and Ice Data Center
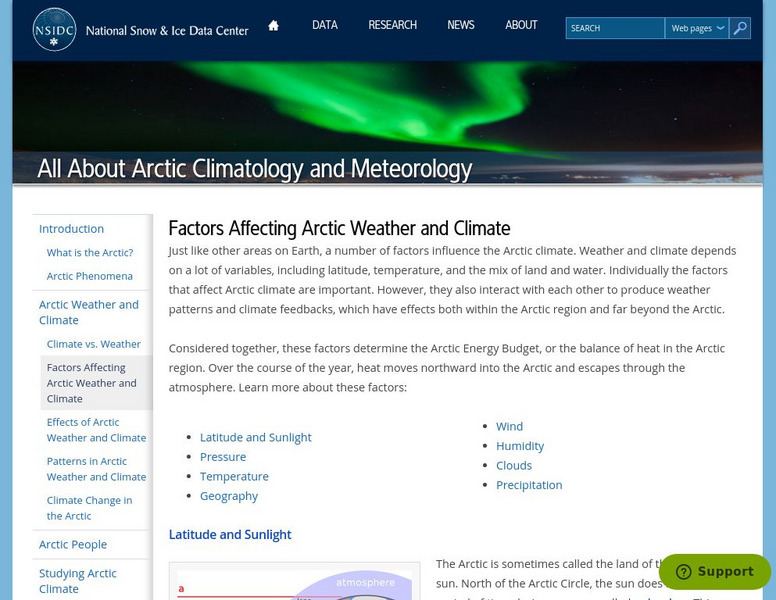
National Snow and Ice Data Center: Factors Affecting Arctic Weather and Climate
An introduction to the factors that affect the Arctic's weather and climate: latitude, land/sea distribution, solar radiation, air temperature, air pressure, winds, humidity, clouds, and precipitation.
CK-12 Foundation
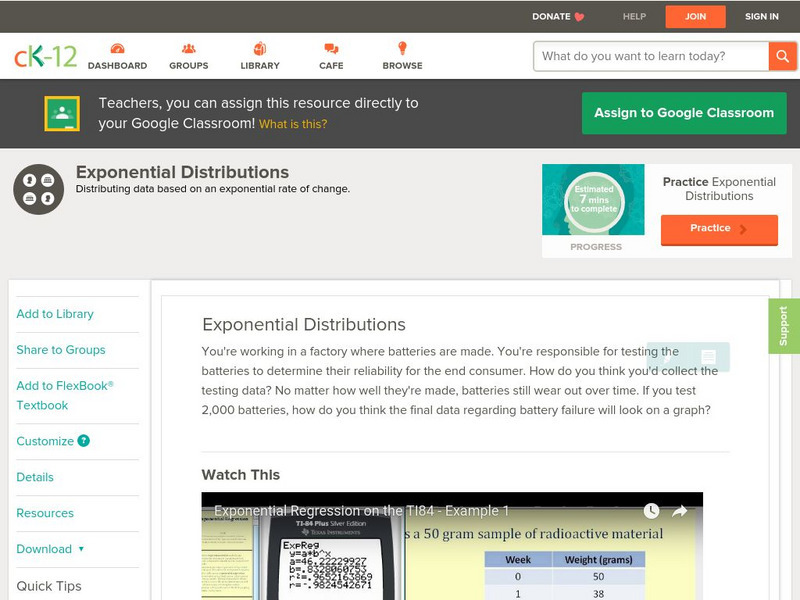
Ck 12: Probability: Exponential Distributions
[Free Registration/Login may be required to access all resource tools.] Covers exponential distributions. Presents examples using a graphing calculator as well as guided and independent practice questions.
Khan Academy
Khan Academy: Comparing Distributions
Practice comparing distributions of data in different forms of graphical representation.
CK-12 Foundation
Ck 12: Interactive Geometry: 11.4 Two Way Frequency Tables
With two pieces of data, learn how to organize the data into a two-way frequency table.
Other
Clayton State: Organizing & Presenting a Frequency Dist.
The easiest method of organizing data is a frequency distribution, which converts raw data into a meaningful pattern for statistical analysis. Learn how in this tutorial with examples.
Khan Academy
Khan Academy: Interpreting Two Way Tables
Do you understand how two-way tables really work? Here's your chance to practice. Students receive immediate feedback and have the opportunity to try questions repeatedly, watch a video, or receive hints.
Khan Academy
Khan Academy: Dot Plots and Frequency Tables Review
Dot plots and frequency tables are tools for displaying data in a more organized fashion. In this article, we review how to make dot plots and frequency tables.
University of California
Ucmp: Island Biogeography and Evolution
This is a lesson designed by a biology teacher. In it, students use maps and evidence of island age, molecular genetics, morphology, and distance apart to determine how the islands came to be occupied by different species of lizards. It...
TeachEngineering
Teach Engineering: All Caught Up
Commercial fishing nets often trap unprofitable animals in the process of catching their target species. In the following activity, students will experience the difficulty that fishermen experience while trying to isolate a target...
Texas Instruments
Texas Instruments: Law of Large Numbers: A Weighty Decision
In this activity, students will explore the Law of Large Numbers. By examining unfair models, they will expand their understanding of probability. They predict the weighting of an unfair model by analyzing experimental data and...
Cuemath
Cuemath: Probability
A comprehensive guide for learning all about probability with definitions, basics of probability, terms used in probability, probability formula, conditional probability, probability distribution, probability density function, law of...
Other
Imagine Hawaii: The People of Hawaii
Detailed facts about the people of Hawaii and its deep cultural diversity. Charts provide data on ethnic distribution and languages spoken.


