Curated OER
Weather with Lewis and Clark
Students track the weather and temperature for the same time period that Lewis and Clark were at Fort Mandan. The students compile data and use it for comparisons.
Curated OER
Circles Minilab
Students learn how to measure the diameter and circumference of a circle. In this circle activity, students organize their data to create a graph. Students utilize their graph to make an inference about the slope of pi.
Curated OER
Impact!!
Students perform a science experiment. In this algebra lesson plan, students collect data from their experiment and create a graph. They analyze the graph and draw conclusion.
Curated OER
A Journey with a Scientist
Students work in groups as they read chapters of Charles Darwin's, Voyage of the Beagle. They take notes on the chapter and in their group make a timeline of the chapter. They tape the timelines together in order to depict the entire...
Curated OER
Testing the Water
Students develop and test a hypotheses through collecting and recording water quality data. They perform their tests outdoors in a location with a safe stream and easy access for students. Their various experiments involve the entire...
Curated OER
The Statistical Nature of Test Data
Students investigate the properties of various metals. They conduct an experiment and gather the data by putting into the proper statistical graphs. The data is analyzed and conclusions are formed according to the properties of the metals.
Curated OER
Census Data and New Hampshire History
Pupils graph the population growth of New Hampshire using historical census data.
Curated OER
Rouge River Data
Students participate in using Excel sofware in order to create graphs. They create the graphs using data that they gathered during the Rouge River Field Trip they attended. The produce bar graphs from the excel spreadsheets.
University of Connecticut
Building Your Own Biosphere
On September 26, 1991, four women and four men entered the scientific experiment, Biosphere 2; the doors were sealed for two years in order to study the interactions of a biosphere. In the activity, scholars explore biospheres by...
Curated OER
Oh, What A Day
Students listen as the teacher reads A Country Far Away. They predict what they will do and what they think their partner student will be doing. Students create a KWL chart for Japan. They collect information about their activities on an...
Curated OER
Lesson Plan: The Net Neutrality Debate
Should Internet users who send data-heavy content pay higher fees than those who are involved in activities, like sending an email, that have less content? This question is at the heart of the Net Neutrality debate. After watching a PBS...
Brine Shrimp: Getting to Know a Salt Water Arthropod
Gather small observations of arthropods. Using brine shrimp, pupils observe the life cycle of arthropods. Learners set up saltwater aquariums and observe the brine shrimp over a three-week period. To finish, they compare and contrast how...
101 Questions
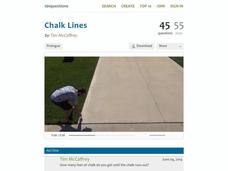
Chalk Lines
Read between the lines to find a solution. Budding mathematicians analyze a situation to solve a problem. They view a video presentation of the problem, brainstorm important information to gather, and write linear equations to find...
Curated OER
Environmental Issues in Multimedia Presentation
Students investigate a community environmental issue. They document it using traditional scientific methods, digital photography, and videotaping. After collecting data, they graph the results. Students present their findings in a...
Curated OER
POSITIVE AND NEGATIVE EXTERNALITIES
Students work as a group to research a current issue, articulate the key points relating to the issue and to have data to support those key points, and use appropriate economic theories to help explain the issues arising.
Common Sense Media
Identifying High-Quality Sites
Use a Huffington Post article focused on false pictures of Hurricane Sandy to launch a discussion about the reliability of online information. Groups compare and contrast how print and broadcast media regulate...
Curated OER
Leading Economic Indicators
Twelfth graders collect the data of the leading economic indicators over the last six months and create graphs plotting the data. They analyze/evaluate the data collected in order to predict economic trends for the next six month period.
Curated OER
Gathering, Evaluating, And Organizing Information for a Report
Students gather and organize information for a research report on a topic of their choosing. Each students selects a subject for their research. Using traditional and electronic data they reference four or more appropriate resources...
Curated OER
Oil Spill
Students use one of four absorbent products to separate as much of the oil and water mixture they are able to do. The purpose of this task is for students to collect and analyze data for the purpose of determining which absorbent is...
Curated OER
Integrated Unit on Nevada Solid Waste Disposal
Sixth graders examine how to gather and interpret data, accept responsibility for the environment, and demonstrate an interest in making a difference in this series of lessons.
Curated OER
Plant Diversity and Distribution
Learners construct a defined plot on school grounds and observed patterns in plant life. They count trees, shrubs, cacti and record on a data sheet. They compare data and generate a plant diversity overlook for their school.
Curated OER
Alfalfa Butterfly/Caterpillar Lifecycle Investigation
High schoolers collect and record data. They identify sex of butterflies. They make conclusions based on collected data.
Curated OER
Shots, Standings, and Shopping
Rates and ratios can easily be applied to real-world situations. Learners explore a series of websites in order to procure comparable data. They define ratios and rates, view videos, and use the internet to explore how ratios and rates...
Other popular searches
- Science Data Gathering
- Gathering and Graphing Data
- Data Gathering Strategies
- Gathering Qualitative Data
- Data Gathering Tests
- Gathering and Charting Data
- Math Data Gathering
- Math, Data Gathering
- Gathering Weather Data
- Data Gathering and Analysis
- Errors in Data Gathering
- Data Gathering Accuracy
