Curated OER
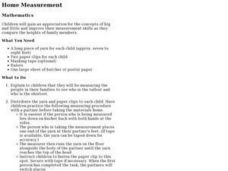
Home Measurement
Students explore the differences between the heights of their family members as they measure, record, and compare the data gathered. Comparisons are made to discover who was the tallest and the shortest member.
Curated OER
Retail Travel Operations
High schoolers examine the structure of the retail travel industry. They analyze trends in the industry and data gathered from real-world situations. They also investigate levels of integration within the industry.
Curated OER
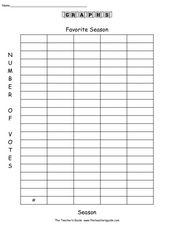
Favorite Season
In this graphing worksheet, learners conduct a survey of people's favorite survey. They then complete 8 questions about the data gathered before creating a bar graph and pictograph on templates.
Curated OER
Scientific Theories
Ninth graders compare and contrast how different models can be used to represent scientific understandings. They evaluate the use of data when considering scientific claims. Students debate a variety of socio-scientific issues and the...
Curated OER
Topic 6: Evaluating and Presenting Results
Young scholars construct spreadsheets from raw data. In this spreadsheet construction activity, students compile data into Microsoft Excel. Young scholars familiarize themselves with entering and presenting data in a spreadsheet.
Curated OER
The Chesapeake Bay in Captain John Smith's Time
When Captain John Smith visited the Chesapeake Bay in the summer of 1608, what types of animals and habitats did he encounter? Your young historians will analyze primary source documents to answer this question, as well as compare...
Curated OER
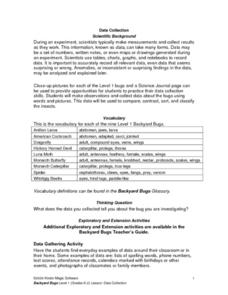
Science: Backyard Bugs Data Collection
Young scholars practice data collection skills by observing common bugs found in their local environment. Once the data is collected they complete data sheets to compare, contrast, sort, and classify the insects. The lesson includes...
Curated OER
Graph and Compare the Adventure's Temperature Vs. Local Temperature
Students explore the concept graphing data. For this graphing data lesson, students use weather data from their local weather and some other city and graph them. Students plot the local weather vs. another city. Students record...
Curated OER
Mapping The Ocean Floor
Young scholars explore and analyze the bottom structure of underwater habitats. They describe and explain what can't see through the collection and correlation of accurate data. Learners assess that technology is utilized as a tool for...
Curated OER
Trajectory Perplexity
Students investigate measuring angles correctly through projectiles. In this geometry lesson, students launch a projectile to investigate the importance of how to measure an angle correctly and to explore trajectory. They collect...
Curated OER
Statistics with State Names
Students analyze the number of times each letter in the alphabet is used in the names of the states. For this statistics lesson, students create a stem and leaf plot, box and whisker plot and a histogram to analyze their data.
Curated OER
Water, Water Everywhere
Students monitor a local creek. In this environmental water lesson, students conduct an environmental study of a local creek by monitoring the temperature and water quality over a period of time, then submit data to the Global Water...
Curated OER
Graphing Favorite Fruit
Third graders take poll and sort data, enter the data to create a spreadsheet and create bar and pie graphs.
Curated OER
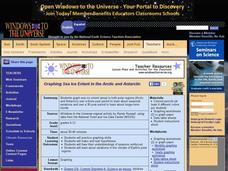
Graphing Sea Ice Extent in the Arctic and Antarctic
Students graph sea ice data and predict long term trends in the data. In this climate change lesson, students use sea ice data from the Arctic and Antarctic to construct line graphs. They use their graphs to predict the effects of global...
Curated OER
Recording Frequency
First graders analyze nursery rhymes and gather data about word frequency. For this frequency lesson, 1st graders create graphs and tables. Students interpret the data.
Curated OER
CLIMATE AND WEATHER UNIT
Students locate on-line weather source, gathers and interprets weather data, work collaboratively on-line with other schools to collect weather data, and write about the cause of temperature inconsistencies in various locations.
Curated OER
The Reasons for the Seasons
Sixth graders conduct a controlled investigation to determine the length of the sun's shadow on a fixed object (i.e., flagpole, telephone pole, etc.) over a three-day period (one day in the fall, one in the winter, and one in the...
Curated OER
A Day on the Farm
First graders, with a collection of various art supplies, plant a seed to observe it growing and record specific data on a data record sheet. They create a collage from various magazines of ten different foods farm animals eat and make a...
Curated OER
Fast Food Survey Using Bar Graphs
Second graders create a bar graph to pictorically represent the data collected from a survey of students. They use Excel to electronically create the graphs and data tallies. They then interpret their data using sentences to explain.
Curated OER
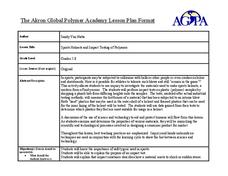
Sports Helmets and Impact Testing of Polymers
Learners examine the importance of good quality safety gear. In this investigative activity, students will tests various polymers, collect data, and analyze the data to determine which polymer is best for safety helmets. They will design...
Curated OER
Celsius to Fahrenheit
Students convert degrees between two different units. In this algebra lesson, students graph linear equations and identify the line of best fit. They use their line of best fit to make predictions given a set of data.
Curated OER
EXCEL It!
Young scholars surf the Web gathering information about graphs. The data collected is incorporated into an Excel spreadsheet and graphs of varying nature generated to further enhance student understanding.
Curated OER
GROWING PLANTS UNIT
Students predict outcomes of scientific experiment,.conduct a scientific experiment with control groups, and plant seeds to observe, measure, and compare growth across groups. They gather, record, analyze, and share data with other...
Curated OER
Weather Tools of the Trade
Fourth graders study the basic meteorological instruments (thermometer, barometer, weather vane, anemometer, and rain gauge). They explore how they are used, data that can be collected from them, and why records of the data are kept.
Other popular searches
- Science Data Gathering
- Gathering and Graphing Data
- Data Gathering Strategies
- Gathering Qualitative Data
- Data Gathering Tests
- Gathering and Charting Data
- Math Data Gathering
- Math, Data Gathering
- Gathering Weather Data
- Data Gathering and Analysis
- Errors in Data Gathering
- Data Gathering Accuracy
