National Council of Teachers of Mathematics
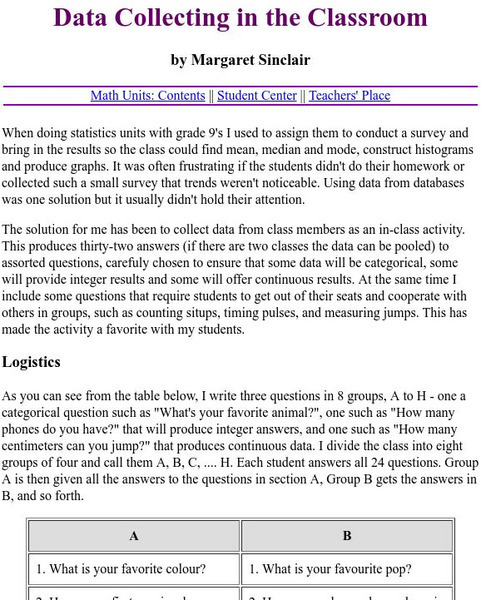
The Math Forum: Data Collecting in the Classroom
A list of two dozen questions students can easily ask eachother in the classroom to quickly collect data in hopes of using it in their study of making graphs. Some are opinion questions, while others require the counting of certain items...
Rice University
Rice University: Cynthia Lanius: Let's Graph
An introduction to bar graphs, both vertical and horizontal in nature. The interactive aspect of this site allows students to change the values of the data - their favorite cafeteria foods - and then see how the graph is changed.
Sophia Learning
Sophia: Using Graphs to Analyze Data
This lesson will demonstrate how to analyze and interpret data given in the form of a graph.
Khan Academy
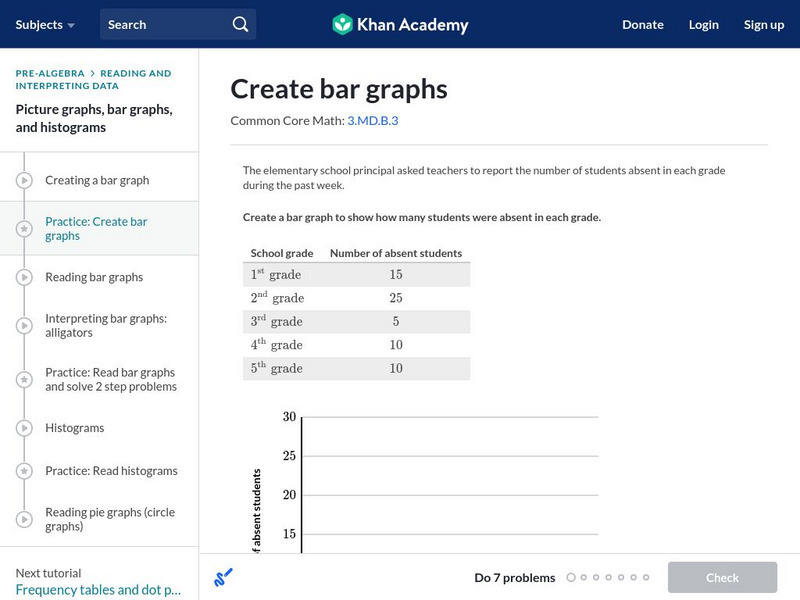
Khan Academy: Create Bar Graphs
Create a bar graph with the data given. Students receive immediate feedback and have the opportunity to try questions repeatedly, watch a video tutorial, or receive hints about creating bar graphs. CCSS.Math.Content.3.MD.B.3 Draw a...
Better Lesson
Better Lesson: Line Graph Activity
Data collected is represented in tables and the students will need to choose what they want to represent in their line graph.
Other
Tulpehocken Area School District: Graphing and Analyzing Scientific Data
Student learning exercise with explanation of pie, bar, and line graphs, the parts of a graph, and the definition of mean, median, and mode. This summary is followed by an exercise for each type of graph within a scientific context.
PBS
Pbs Learning Media: Graphs, Charts, and Tables: Targeted Math Instruction
At the end of this lesson about graphs, charts, and tables, students will be able to interpret and compare data from graphs (including circle, bar, and line graphs), charts, and tables.
National Center for Ecological Analysis and Synthesis, University of California Santa Barbara
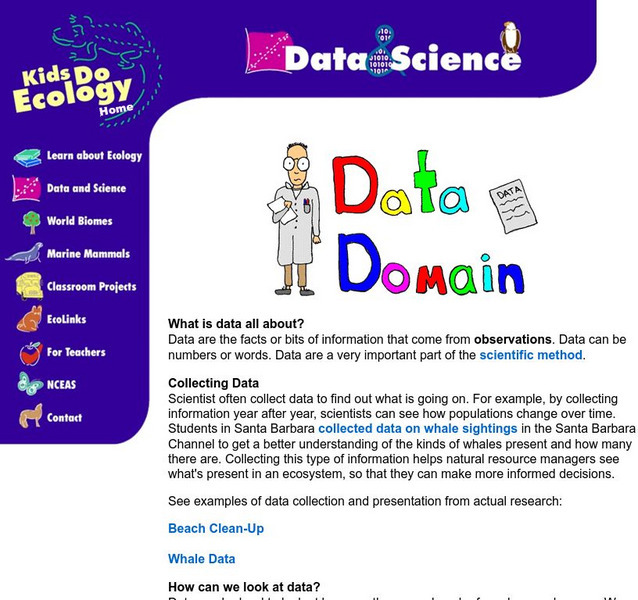
Nceas: What Are Data?
This site from NCEAS answers many questions about data. You can also learn about data, tables, and types of graphs in this informative site.
Khan Academy
Khan Academy: Picture Graphs (Pictographs) Review
Picture graphs are a fun way to display data. This article reviews how to create and read picture graphs (also called pictographs).
Khan Academy
Khan Academy: Bar Graphs Review
Bar graphs are a nice way to visualize categorical data. This article reviews how to create and read bar graphs.
Rice University
Rice University: The Hand Squeeze
Students will enjoy this data collection and class analysis experiment involving the time it takes for a hand squeeze to travel around a circle of people. From organizing the activity to collecting the data to making a table and graphing...
Khan Academy
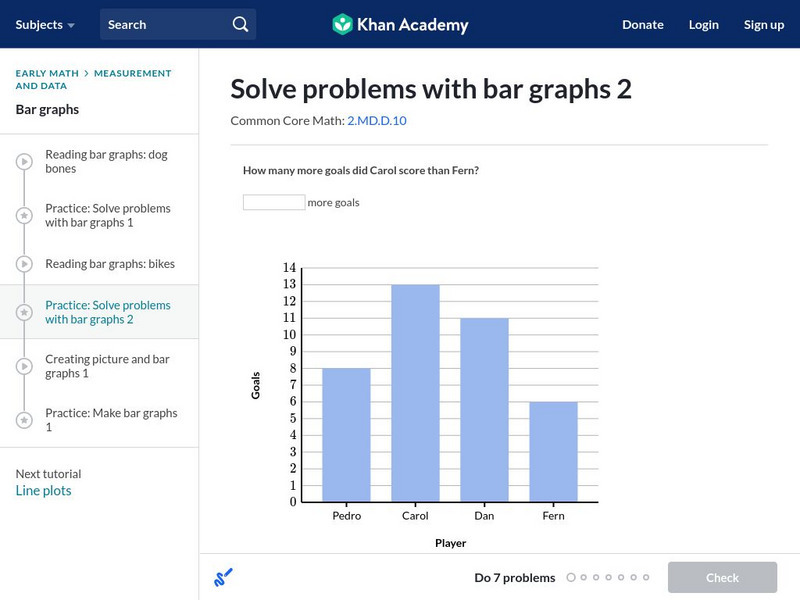
Khan Academy: Solve Problems With Bar Graphs 2
Use bar graphs to solve addition and subtraction word problems. Students receive immediate feedback and have the opportunity to try questions repeatedly, watch a tutorial video, or receive hints.
Other
Science Fair Primer: Reporting the Results
A good explanation of the elements of a good science fair report written by a high school science teacher. Details are given step by step on stating the hypothesis, explaining the experimental procedure, presenting the data attained, and...
Geographypods
Geographypods: Weather and Climate Graphing It!
Explores the difference between weather and climate and how they are measured. Students will complete activities and construct a climate graph from raw data. They will also learn about the physical structure of the rainforest, its...
US Department of Education
Helping Your Child Learn Math: Math in the Home
An excellent compilation of activities that engage parents and children in math explorations at home. Detailed lessons covering a wide range of math topics such as fractions, measurements, money, data collection, and math in newspapers....
Better Lesson
Better Lesson: What Is Your Favorite Pet?
SWBAT create a bar graph to match a data set. SWBAT analyze the graph to find 3 pieces of information the graph shows them.
Better Lesson
Better Lesson: What Is Your Favorite Little Bear Story?
SWBAT create a bar graph to match a data set. SWBAT analyze the graph for 3 pieces of information.
Science and Mathematics Initiative for Learning Enhancement (SMILE)
Smile: Apples a Peel to Me
This lesson plan helps children understand how to graph data by using both real objects, apples, and pictures of apples. Great activity for a variety of themes.
Illustrative Mathematics
Illustrative Mathematics: Color Week
Five-year-olds need to count things that relate to them. This activity builds on their need to be included or see the relevance of their counting. Students will practice counting, writing numbers, and filling in a chart or bar graph....
University of Texas at Austin
Mathematics Teks Toolkit: And We Go Around
Collect and display data using a bar and circle graph to explore fractions and percents.
Better Lesson
Better Lesson: Greedy Gordy Can't Decide Working With Venn Diagrams
Students have been working with pictographs and bar graphs. Now they take their learning a step further by working with Venn Diagrams.
PBS
Pbs: Toothpicks: Patterns in Geometric Shapes
How can you describe the pattern made by a growing triangular shape? This interactive exercise focuses on using what you know about pattern recognition and completing a table so you have data you can use to graph the coordinates on a...
University of Illinois
University of Illinois: Spreading It Thick
Resource contains the definition for variance. It also shows students how to calculate the variance. There is a link to a bar graph that displays variance for the data example.
Other popular searches
- Data Collection and Graphs
- Graphs Interpreting Data
- Graphs and Data Display
- Graphs and Data Tables
- Create Data Tables From Graphs
- Continuous Data Graphs
- Circle Graph Data Set
- Collect Data and Graphs
- Extrapolation Graphs Data
- Graphs and Data
- Graphs and Data Handling
- Graphs Analyze Data
