Curated OER
Sports Helmets and Impact Testing of Polymers
Students examine the importance of good quality safety gear. In this investigative instructional activity, students will tests various polymers, collect data, and analyze the data to determine which polymer is best for safety helmets....
Curated OER
Multiplication
Third graders discover a connection between numbers of things in groups and groups. They solve number line puzzles for multiplications and identify data for 3 riddles in a multiplication context. They use number lines as sources for...
Curated OER
CLIMATE AND WEATHER UNIT
Students locate on-line weather source, gathers and interprets weather data, work collaboratively on-line with other schools to collect weather data, and write about the cause of temperature inconsistencies in various locations.
Curated OER
The Big Bang-Hubble's Law
In this Hubble's law worksheet, students use data for galaxies which include their distance and speed. Students make a graph to show the distance to each galaxy and the speed of each galaxy. They use their graph to answer 4 questions...
Curated OER
Statistics with State Names
Students analyze the number of times each letter in the alphabet is used in the names of the states. For this statistics lesson, students create a stem and leaf plot, box and whisker plot and a histogram to analyze their data.
Curated OER
Cockroach Slope
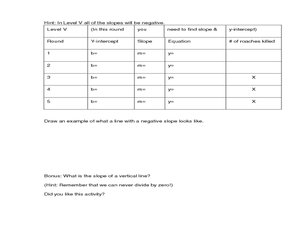
Students identify the slope of linear functions. In this slope lesson, students collect data and graph it. They write equations with no more than two variables and use technology to explain their data.
Curated OER
Linear and Exponential Models
High schoolers investigate the differences between linear and exponential models. In this linear and exponential models lesson, students make a table of given data. High schoolers determine if the data is linear or exponential by...
Curated OER
Cars on the Curve
Second graders, using two dice, participate in a car race game called Cars on the Curve. They predict which car wins the game and records it in their Data Diary.
Curated OER
Earth's Warming Climate: Are We Responsible
Students examine the atmospheric data for CO2. In this web-based atmospheric lesson plan, student follow instructions to examine and plot on-line scientific data about the CO2 levels in our atmosphere and analyze the changes found in the...
Curated OER
Trajectory Perplexity
Students investigate measuring angles correctly through projectiles. In this geometry lesson, students launch a projectile to investigate the importance of how to measure an angle correctly and to explore trajectory. They collect data...
Curated OER
Project Interactive--Stem and Leaf Plotter
In this excellent stem and leaf plotter worksheet, students construct, arrange and write a report of how to interpret the leaves they collect in this data analysis. Students answer 4 detailed questions regarding the data analysis...
Curated OER
Scientific Method- "The Big Ahah"
Students experiment with water, dropper and a coin to study the scientific method. In this scientific method lesson plan, students are in groups, each with a coin, water and a dropper. They investigate how many drops of water can fit on...
Curated OER
How Does the Angle Effect How Fast a Car Will Travel?
In this angle of movement and speed worksheet, students determine at which angle a car will travel the fastest. They test 12 different angles on a toy car and determine from their data which angle is the best for speed.
Curated OER
Flight of Angles of Inclination
High schoolers measure the flight of a gilder. For this fight of angles lesson, students explore the flight of a glider and measure the distance flown. They collect statistical data of the flights and determine the slope of each flight....
Curated OER
Energy and Changes of State
Students complete a variety of labs to help them explain how energy affects the changes in states of matter. They also be required to collect and record data, graph data, and apply interpretations of that data.
Curated OER
What Does Average Look Like?
Fifth graders explore the concepts of range, median, mode, and mean through the use of graphs drawn from models. They use manipulatives to represent data they have collected within their groups, and compare the differences between mode,...
Curated OER
Functions and Inverses
Students solve problems identifying the functions and inverses. In this algebra lesson, students identify a one-to-one function, and perform the horizontal line test. They analyze data and graph their results on a graph.
Curated OER
Fitting Periodic Functions-Distant Planets
For this periodic functions worksheet, students use given data of the speed of a star and find the best fit periodic function that follows the trend in data. They determine the amplitude, offset phase and the formula for the angle. They...
Curated OER
The Phone Bill Problem
Students write an equation for a linear function. In this algebra lesson, students collect data, plot it and graph it. They identify the equation of the graphed data and define the slope and y-intercept of the graph.
Curated OER
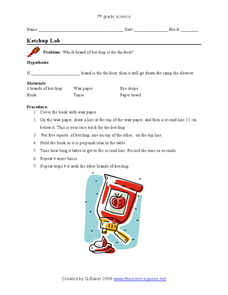
Ketchup Lab
In this ketchup worksheet, students investigate the thickness of different types of ketchup. They hypothesize, identify their independent and dependent variables, test their hypothesis and write conclusions based on their data.
Curated OER
Counting Candies
Students count, sort, and classify jellybeans by color. They use their data to create a bar graph. Students are given a small bag of jellybeans, and a worksheet on Counting Candies Tally Chart. They work in small groups. Students are...
Curated OER
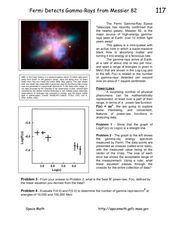
Fermi Detects Gamma-Rays from Messier
In this power law function worksheet, students use data from the Fermi Gamma-Ray Space telescope to apply the power law function to physical phenomena. Students use a graph to solve four problems.
Curated OER
Mapping the Ocean Floor
Students construct and interpret a line graph of ocean floor depth and a bar graph comparing the height/depth of several well-known natural and man-made objects and places. In addition, they calculate the depth of two points using sonar...
Curated OER
Exploring The Depths!
Fifth graders make a model of the ocean floor. In this ocean characteristics lesson, 5th graders complete a KWL chart about the ocean floor, use the Ocean Depth Data Sheet to create a graph, and create a 3-D model of the ocean floor.


