Texas Instruments
Texas Instruments: Golden Ratio
In this activity students will measure various body parts looking for the golden ratio. The teacher will collect the various measurements from the calculators and send an augmented list to the students calculators. Students will then...
National Council of Teachers of Mathematics
Nctm: Figure This: Tv Ratings (Pdf)
Here's a challenge for the avid TV watcher. Use your data interpretation skills to explore America's TV watching habits in this NCTM Math Challenges for Families activity. See if you can figure out which night of the week has the...
Illustrative Mathematics
Illustrative Mathematics: 6.rp Overlapping Squares
Students use ratio and rate to answer this performance task: The data transfer rate of an Internet connection is the rate in bytes per second that a file can be transmitted across the connection. Data transfer is typically measured in...
Illustrative Mathematics
Illustrative Mathematics: 6.rp Games at Recess
Students use ratios to answer three questions based on a specific set of data in this performance task.
PBS
Pbs: Real World Proportional Relationships: Gender Wage Gap
Using this infographic, learn how wage equity today compares with data from 50 years ago, at the dawn of the equal pay movement. The accompanying classroom activity invites students to explore the change in the gender wage gap from 1965...
Social Science Education Consortium
Ssec: Employment Unemployment: How Can Both Rates Rise at the Same Time? [Pdf]
For this investigation, students are asked to explain a Wall Street Journal (WSJ) announcement about unemployment, and look for a contradiction in the message. Then they are introduced to the definitions of employment, unemployment, and...
PBS
Pbs Teachers: Alien Invasion: Estimating a Snake Population [Pdf]
Learn about the effects of alien species on native environments and explore biologists' use of capture/recapture statistics and analysis of sampling techniques by estimating the population size of a tagged species.
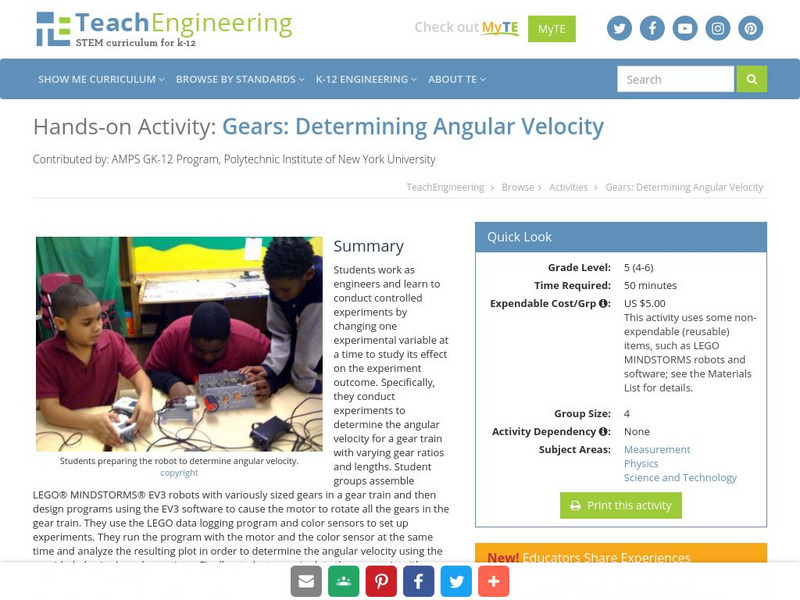
TeachEngineering
Teach Engineering: Gears: Determining Angular Velocity
Students work as engineers and learn to conduct controlled experiments by changing one experimental variable at a time to study its effect on the experiment outcome. Specifically, they conduct experiments to determine the angular...
Science Education Resource Center at Carleton College
Serc: Take a Deep Breath on the Appalachian Trail
A lesson plan that includes a PowerPoint learning module for students. They will examine spreadsheet data on air quality in Great Smoky National Parks, and solve problems using ratio and proportion. The exercises will help them to...
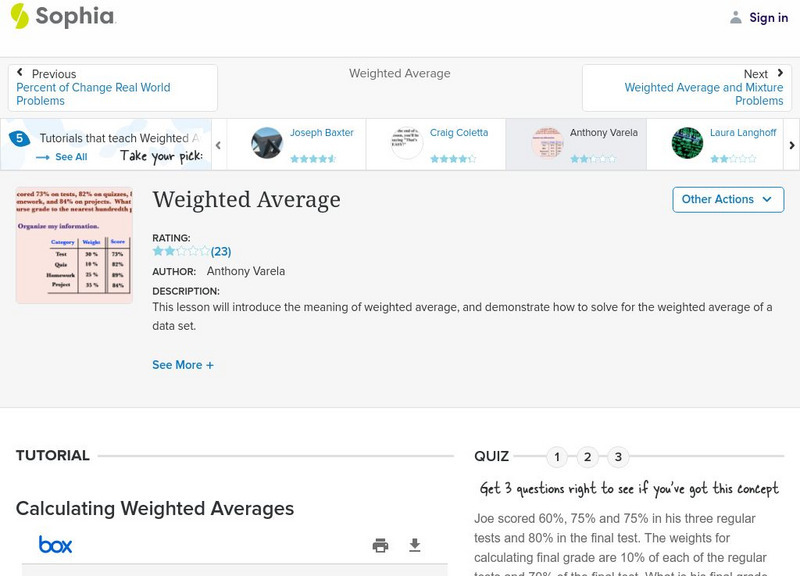
Sophia Learning
Sophia: Weighted Average
This lesson will introduce the meaning of weighted average, and demonstrate how to solve for the weighted average of a data set. Students can look at a presentation and then take an online quiz.
PBS
Pbs: The Lowdown: Indoor/outdoor Residential Water Use in California
Compare data about indoor and outdoor residential water use in northern and southern sites in this infographic from KQED and the California Single Family Water Use Efficiency Study. The accompanying classroom activity helps students find...
PBS
Pbs: The Lowdown: Poverty Trends: What Does It Mean to Be Poor in America?
Use math to learn about changes in US wealth distribution and poverty rate over time in this interactive from KQED. In the accompanying classroom activity, students interpret the graphs and consider how the poverty rate spike following...
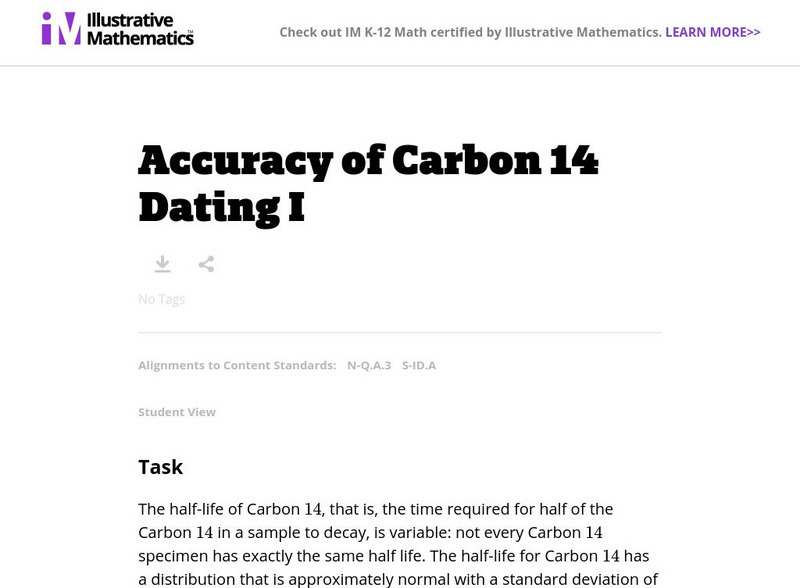
Illustrative Mathematics
Illustrative Mathematics: N q.a.3 and S id.a: Accuracy of Carbon 14 Dating I
This task examines, from a mathematical and statistical point of view, how scientists measure the age of organic materials by measuring the ratio of Carbon 14 to Carbon 12. The focus here is on the statistical nature of such dating....
PBS
Pbs: Jazz and Math: The Beat Goes On
This lesson will require students to collect data through listening, counting and timing. They will use ratios, rates, and proportions to report data. They will also demonstrate an understanding of the concepts of rhythm and tempo in music.
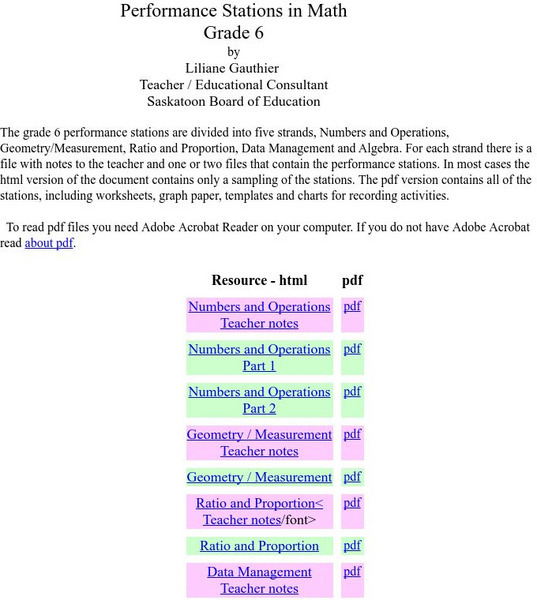
University of Regina (Canada)
University of Regina: Math Central: Performance Stations in Math: Grade 6
The Saskatoon Board of Education provides teachers with this collection of grade six math performance stations. Although several of the stations have been designed as assessment tools for the Saskatchewan curriculum, teachers may also...
University of Regina (Canada)
University of Regina: Math Central: Performance Stations in Math: Grade 7
The Saskatoon Board of Education provides teachers with this collection of grade seven math performance stations. Although several of the stations have been designed as assessment tools for the Saskatchewan curriculum, teachers may also...
University of Regina (Canada)
University of Regina: Math Central: Performance Stations in Math: Grade 8
The Saskatoon Board of Education provides teachers with this collection of grade eight math performance stations. Although several of the stations have been designed as assessment tools for the Saskatchewan curriculum, teachers may also...
University of Regina (Canada)
University of Regina: Math Central: Performance Stations in Math: Grade 9
The Saskatoon Board of Education provides teachers with this collection of grade nine math performance stations. Although several of the stations have been designed as assessment tools for the Saskatchewan curriculum, teachers may also...
Other
Ode: Seventh Grade Achievement Test (Practice Test) [Pdf]
Half-length practice test for the third grade OAT (Ohio Achievement Test). The test includes 17 multiple-choice and 4 open-response questions dealing with topics such as number sense (order of operations, ratios), measurement (metric...
Other
Canadian Centre for Energy Information: Counting on Gasoline [Pdf]
In this teaching resource for Grades 8 to 12, students develop an understanding of how gas prices are calculated, applying their Math skills in ratio, percent, data analysis, etc. to real life scenarios.
Sophia Learning
Sophia: Weighted Average
This lesson will introduce the meaning of weighted average, and demonstrate how to solve for the weighted average of a data set. Students can look at a presentation and then take an online quiz.
National Council of Teachers of Mathematics
Nctm: Figure This: Grape Juice Jungle
Are all juice grape juice concentrates the same? Find out when you explore ratio and fractions in this math challenge that compares juice recipes to identify strongest taste. A one page activity from the NCTM Math Challenges for Families...
Other
Stat Soft: Getting Started With Statistics Concepts
Definitions of the basic concepts in statistics. Great for review and discussion or for introduction into topics.
Texas Instruments
Texas Instruments: Give Me a Sine (And a Cosine) Using Ti Navigator
In this lesson, students contribute data points to build graphs of the sine and cosine functions. The transition from trig ratios to trig functions is a particularly difficult one, but it is also one where the social space of the...


![Pbs Teachers: Alien Invasion: Estimating a Snake Population [Pdf] Activity Pbs Teachers: Alien Invasion: Estimating a Snake Population [Pdf] Activity](https://content.lessonplanet.com/knovation/original/42719-3ab379f516ca5265608d3b9539483f02.jpg?1661419221)
