Space Awareness
A View From Above
Analyzing and interpreting satellite data takes knowledge and patience. Through a detailed lab investigation, young scholars learn the process of analyzing this data. They use technology to create color images and maps from real...
Statistics Education Web
Types of Average Sampling: "Household Words" to Dwell On
Show your classes how different means can represent the same data. Individuals collect household size data and calculate the mean. Pupils learn how handling of the data influences the value of the mean.
Los Angeles County Office of Education
Assessment for the California Mathematics Standards Grade 2
Test scholars mathematic skills with an assessment addressing addition, subtraction, multiplication, place value, measurement, geometric shapes, expanded notation; and their ability to compare numbers, write number sentences, draw...
Los Angeles County Office of Education
Assessment for the California Mathematics Standards Grade 1
Here is an assessment designed to test mathematicians' knowledge of writing numbers, comparing numbers, skip counting, solving addition and subtraction problems; along with measuring objects, telling time, identifying shapes, reading...
Bowland
Football, the Beautiful Game
Discover how to use mathematics to make a stronger soccer team. Young soccer enthusiasts use given data to make decisions about a soccer team. They decide which position to assign each player, consider what makes a good pass and...
Radford University
What Is Normal?
Are you taller than a Major League Baseball player? Future mathematicians learn about normal distributions, percentiles, z-scores, and areas under a normal curve. They use the concepts to analyze height data of Major League Baseball...
Curated OER
Linear and Quadratic Model, Data Modeling
Students model quadratic and linear equations. In this algebra instructional activity, students solve word problems using equations. They create scatter plots and make predictions using correlations.
Curated OER
Hardy-Weinberg Lab Data
The ten slides give multiple examples of Genetic Drift, or cases of particular genetic populations. Each set of data requires an explanation and the allele frequency changes should be easy for your students to calculate.
Curated OER
The Dog Days of Data
Learners practice an alternative form of data presentation. They practice sequencing data, identifying the stem-and-leaf, creating stem-and-leaf plots, and drawing inferences from the data by viewing the plots.
Curated OER
The Dog Days of Data
Young scholars are introduced to the organization of data This lesson is designed using stem and leaf plots. After gather data, they create a visual representation of their data through the use of a stem and leaf plot. Students...
Curated OER
Measuring Dispersion
Students compute the standard deviation for a given set of data. For this measuring dispersion lesson, students compute the mean, and then the distance from the mean for each data point. They find the standard deviation of the data.
Curated OER
Related Data Sets
In this algebra worksheet, 11th graders describe correlation between the different data. They describe the situation that is not a casual relationship. There is and answer key to this problem.
Curated OER
Salt Front Data Set Activity
In this salt front activity, students analyze data from the Hudson River and calculate highest and lowest River Mile locations as well as range of the salt front for each month on the data chart. After completing calculations, they...
Curated OER
China's Population Growth
Learners collect data from China's population growth and determine the mean, median, and mode from the data. In this data lesson plan, pupils determine probabilities and use them to make predictions.
Curated OER
What's Your Shoe Size? Linear Regression with MS Excel
Learners collect and analyze data. For this statistics lesson, pupils create a liner model of their data and analyze it using central tendencies. They find the linear regression using a spreadsheet.
Curated OER
Box Plots
Young statisticians are introduced to box plots and quartiles. They use an activity and discussion with supplemental exercises to help them explore how data can be graphically represented.
Curated OER
All in the Family
Students use data to make a tally chart and a line plot. They find the maximum, minimum, range, median, and mode of the data. Following the video portion of the lesson, students will visit a Web site to test their data collection skills...
Curated OER
Fire Wars
Your class can practice collecting and analyzing data. They extrapolate information and derive data from fire season statistics. They also choose the most appropriate format to display collected data.
Curated OER
Raisin the Statistical Roof
Use a box of raisins to help introduce the concept of data analysis. Learners collect, analyze and display their data using a variety of methods. The included worksheet takes them through a step-by-step analysis process and graphing.
Curated OER
Mean, Median, Mode, Range
Learners engage in a study of mean, median, mode, and range in order to represent data in tables. They are also exposed to the results of data that is skewed because of the outlier.
Curated OER
Videobusters
A real-world scenario, Videobusters, a video rental store has just got to get organized. In small groups, the class works on organizing and analyzing data utilizing matrices. They need to use their skills in adding, subtracting and...
Curated OER
Data Analysis
In these data analysis worksheets, students complete 4 worksheets of activities for analyzing data. Students use the mean, median, mode, and range to organize the data.
Curated OER
Data Handling: Bar Chart Showing Frequency
In this bar graph worksheet, learners analyze a bar graph showing soccer goals scored. Students then use the data to solve 7 problems.
Curated OER
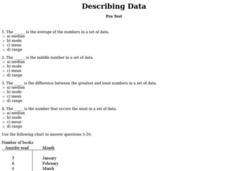
Describing Data
In this data learning exercise, students complete multiple choice questions about mean, median, mode, and range. Students complete 10 questions total.
Other popular searches
- Data Sets Data Collection
- Linear Data Sets
- Comparing Two Data Sets
- Quadratic Data Sets
- Data Sets and Graphs
- Compare Related Data Sets
- Experiments and Data Sets
- Correlation of Data Sets
- Create Data Sets
- Circle Graph Data Set
- Compare Data Sets
- Compare Two Sets of Data


