Science Education Resource Center at Carleton College
Serc: Mn Step: Statistical Analysis of Lincoln
For this activity, students first work in groups to collect information about a set of pennies. They measure and record the mass for each one in a table using a spreadsheet program if possible. They also record its year and, for 1982...
Columbia University
Nasa: Sedac: Infrastructure
[Free Registration/Login Required] A collection of five data sets from SEDAC (Socioeconomic Data and Applications Center) that look at road networks, reservoirs, and dams in countries around the world, with one set examining China's...
TED Talks
Ted: Ted Ed: David Mc Candless: The Beauty of Data Visualization
Listen and watch as David McCandless turns complex data sets into beautiful, simple diagrams. He suggests that information design is really important because we all like to visualize our information. [18:19]
Other
Nearpod: Introduction to Data Representation
In this lesson on representation data, young scholars explore how to make dot plots, histograms, and box plots and learn about outliers in a data set.
Better Lesson
Better Lesson: Graph Party
First graders will be involved in creating three different types of graphs and then be asked to answer questions about each representations data set.
NASA
Nasa: Cobe: Cosmic Background Explorer
The Cosmic Background Explorer, or COBE, satellite began its space mission in November of 1989. Its task was to measure radiation levels from the early stages of the universe. This site explains the mission goals, COBE's specialized...
Alabama Learning Exchange
Alex: Get on Your Mark, Get Set, Go!
In collaborative/cooperative groups, students will review basic vocabulary and concepts for data and statistics. Students will create, collect, display, and interpret data in the form of frequency tables, bar graphs and circle graphs.
Childnet
Childnet: Online Safety: Privacy and Data
Privacy is the ability to keep certain things to yourself, for them not to be seen by or shared with others. Personal data is information about you collected by the apps and websites you visit (like the things you like and open). This...
Sophia Learning
Sophia: Continuous Data
Continuous data is defined and examples are given in this lesson.
Sophia Learning
Sophia: Discrete Data
Explore the term discrete data and look at examples for further explanation.
Columbia University
Nasa: Sedac: Environmental Governance and International Treaties
[Free Registration/Login Required] A collection of thirteen data sets from SEDAC (Socioeconomic Data and Applications Center) that examine international efforts to protect the environment. They look at international treaties,...
Columbia University
Nasa: Sedac: Health and the Environment
[Free Registration/Login Required] A collection of twenty-three data sets from SEDAC (Socioeconomic Data and Applications Center) that examine health issues and how the environment impacts health in areas around the globe. They look at a...
Columbia University
Nasa: Sedac: Land Use and Land Cover Change
[Free Registration/Login Required] A collection of twenty-six data sets from SEDAC (Socioeconomic Data and Applications Center) that examine land use and how human activities have impacted on land cover. They look at agriculture, loss of...
Columbia University
Nasa: Sedac: Marine and Coastal Regions and Sea Level Rise
[Free Registration/Login Required] A collection of fifteen data sets from SEDAC (Socioeconomic Data and Applications Center) that examine the impact rising sea levels is having on marine and coastal regions. They look at mangrove...
Columbia University
Nasa: Sedac: Population Distribution and Change
[Free Registration/Login Required] A collection of forty-nine data sets from SEDAC (Socioeconomic Data and Applications Center) that examine the distribution of human populations around the world and the changes that have taken place in...
Columbia University
Nasa: Sedac: Poverty and Economic Indicators
[Free Registration/Login Required] A collection of twelve data sets from SEDAC (Socioeconomic Data and Applications Center) that examine global poverty and economic factors that contribute to poverty. They look at infant mortality,...
Columbia University
Nasa: Sedac: Applications of Satellite Remote Sensing
[Free Registration/Login Required] A collection of twenty-eight data sets from SEDAC (Socioeconomic Data and Applications Center) that examine ways in which remote sensing by satellites gives us useful information about the world....
Columbia University
Nasa: Sedac: Environmental Sustainability Indicators and Trends
[Free Registration/Login Required] A collection of ninety-four data sets from SEDAC (Socioeconomic Data and Applications Center) that examine the state of the environment and environmental protection and sustainability in countries...
Columbia University
Nasa: Sedac: Urbanization and Human Settlements
[Free Registration/Login Required] A collection of twenty data sets from SEDAC (Socioeconomic Data and Applications Center) that examine urbanization in major metropolitan areas of the United States in the late 20th and the early 21st...
Columbia University
Nasa: Sedac: Water Resources and Consumption
[Free Registration/Login Required] A collection of twenty-four data sets from SEDAC (Socioeconomic Data and Applications Center) that examine water resources and issues around the world. They look at dams and reservoirs, floods, drought,...
Texas Instruments
Texas Instruments: It's a Small World
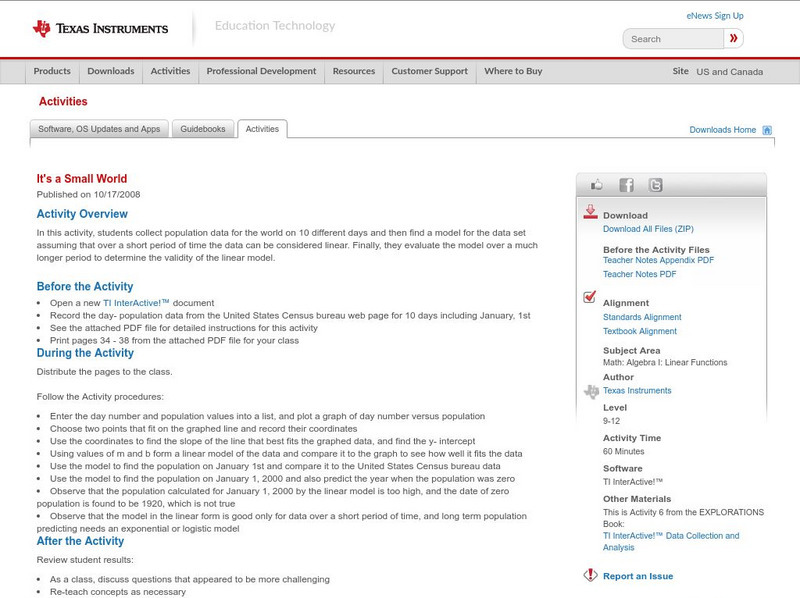
In this activity, students collect population data for the world on 10 different days and then find a model for the data set assuming that over a short period of time the data can be considered linear. Finally, they evaluate the model...
Texas Instruments
Texas Instruments: Scatter Plots
Basic activity of collecting data and graphing sets of data to see if there is a relationship.
ABCya
Ab Cya: It's Glow Time Mean, Median, Mode, & Range
Want to have fun while learning Mean, Median, Mode, and Range? Well... It's Glow Time! In this game kids can play a favorite arcade game to earn tickets and points, and then analyze the data. Type in the correct answers to enter Free...
Science Education Resource Center at Carleton College
Serc: Reasoning About Center and Spread: How Do Students Spend Their Time?
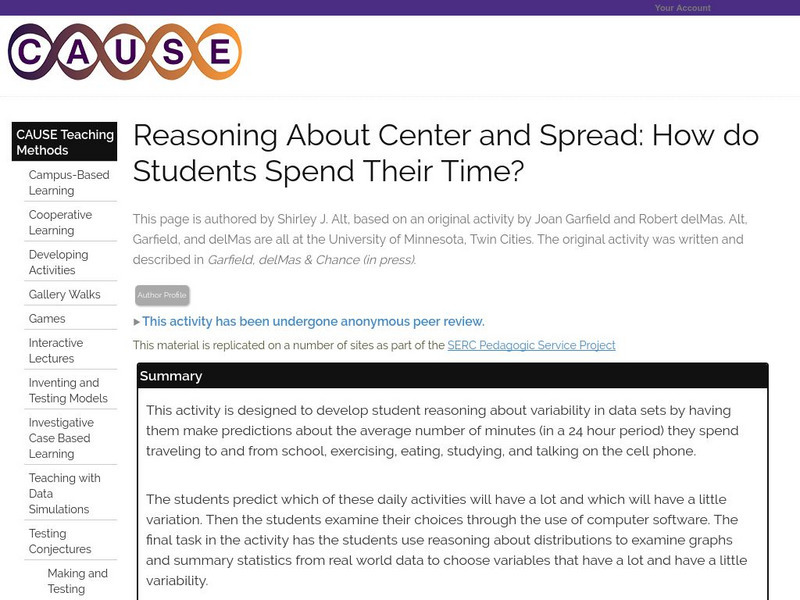
Using their own habits for data, students predict how much time they spend on different activities each day, and how much variability each activity is likely to have. They then collect data into a class spreadsheet and look at the...


