Mabry MS Blog
Scatter Plots
Scatter plots are a fun way to gather and collect relevant data. The presentation goes through several examples and then describes the different types of correlation.
Mathematics Assessment Project
Modeling Motion: Rolling Cups
Connect the size of a rolling cup to the size of circle it makes. Pupils view videos of cups of different sizes rolling in a circle. Using the videos and additional data, they attempt to determine a relationship between cup...
Kenan Fellows
Determining Stream Health by the Diversity and Types of Benthic Organisms
How diverse are the benthic organisms found in local streams? Using the information learned in previous lessons on identification of macroinvertebrates and on calculating stream index values, groups determine the health of local...
Curated OER
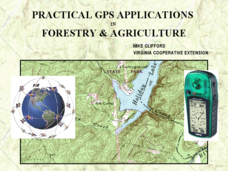
Practical GPS Applications in Forestry & Agriculture
An explanation of the Global Positioning System (GPS) and the Geographic Information System (GIS) is given in this presentation. Uses and applications are considered. How it works and sources of error are also touched upon. A large...
Sophia Learning
Sophia: Continuous Data
Continuous data is defined and examples are given in this lesson.
Sophia Learning
Sophia: Discrete Data
Explore the term discrete data and look at examples for further explanation.


