Texas Instruments
Texas Instruments: Bivariate Data
This set contains statistics questions regarding bivariate data: scatter plots, the least-squares regression line, and their interpretation. The student is asked about the meaning of the various strengths and directions of linear...
Texas Instruments
Texas Instruments: Least Squares Data Fitting
This activity will allow the student to generate an equation from data points based on minimizing the sum of squares of the vertical distances from each point.
Texas Instruments
Texas Instruments: Fitting an Equation to Bivariate Data
In this activity, students fit a linear least-square regression line to population data. They explore various functions to model the given data.
Texas Instruments
Texas Instruments: Exploring Bivariate Data
Students graph scatter plots and understand the concepts of correlation and least-squares regression. They also perform transformations to achieve linearity in the data plot.
Texas Instruments
Texas Instruments: Special Cases of Normally Distributed Data
Students perform single and two-sample t procedures to investigate special cases of normally distributed data. They explore inference for a least-square regression line, including the confidence interval.
University of Colorado
University of Colorado: Ph Et Interactive Simulations: Least Squares Regression
Create your own scatter plot or use real-world data and try to fit a line to it. Explore how individual data points affect the correlation coefficient and best-fit line.
Other
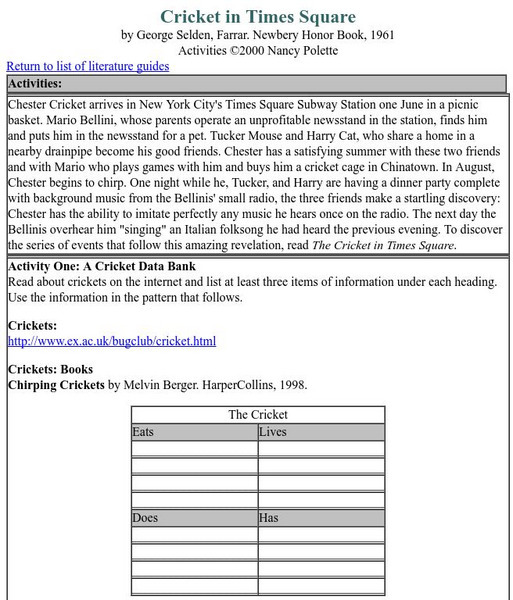
Nancy Polette: "Cricket in Times Square" Literature Guide
Lists a number of activities to accompany the book by George Selden including a cricket data bank and an internet scavenger hunt. Part of a larger site of elementary literature resources available though a link at the top of the page.
Texas Instruments
Texas Instruments: Testing Goodness of Fit and Two Way Table Chi Square
Students perform chi-square tests to see if data follows a hypothesized distribution. They also study the two-way table analysis.
Illustrative Mathematics
Illustrative Mathematics: S Id Coffee and Crime
This task addresses many standards regarding the description and analysis of bivariate quantitative data, including regression and correlation. Given a scatter plot, students will answer a variety of questions about linear relationships,...
Texas Instruments
Texas Instruments: Ti Using the Chi Squared Significance Test
In this activity, students will apply the Chi Squared test for independence to a data set of high school AP Statistics Exam scores. They will set up a two-way table and calculate the chi squared test statistic by hand.
Alabama Learning Exchange
Alex: Beep! Beep! Move Over! I Am Going to Be Late!
During this lesson, students will investigate how to "clear up" the "Traffic Jam." They will be using large manipulatives (their bodies), small manipulatives (carpet squares), and technology (the Java applet) to find the relationship...
ClassFlow
Class Flow: Magic Squares
[Free Registration/Login Required] Students solve arithmetic problems in sequences to create magic squares.
Wolfram Research
Wolfram Math World: World's Most Extensive Mathematics Resource
MathWorld provides a huge mathematics encyclopedia detailing the concepts of geometry, algebra, calculus, discrete math, number theory, and other math topics--complete with formulas, diagrams, examples, and references for thorough...
Texas Instruments
Texas Instruments: Light at a Distance: Distance and Light Intensity
In this activity, students can use a light sensor to record the light intensity at various distances from a bulb. They will compare the data to an inverse square and a power law model.
PBS
Pbs Learning Media: The Squares Game
In this video segment from "Cyberchase", the CyberSquad determines the fairness of a game in which there are three shapes distributed equally on nine squares. Uses popups, two minutes and 13 seconds.
University of Colorado
University of Colorado: Ph Et Interactive Simulations: Curve Fitting
Drag data points and their error bars, and watch the best-fit polynomial curve update instantly. Choose the type of fit: linear, quadratic, cubic, or quartic. The reduced chi-square statistic shows when the fit is good.
Texas Education Agency
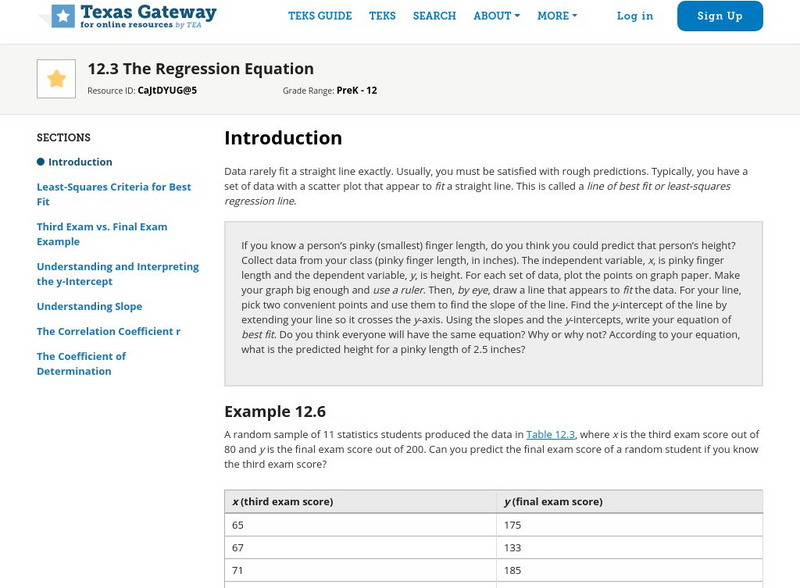
Texas Gateway: Tea Statistics: The Regression Equation
A tutorial on how to find the line of best fit or least-squares regression line for a set of data in a scatter plot using different methods and calculations.
Concord Consortium
Concord Consortium: Geniventure
Geniventure engages students in exploring heredity, genetics, and the protein-to-trait relationship by breeding and studying virtual dragons. Students play through six levels of challenges, conducting simulated experiments that generate...
Illustrative Mathematics
Illustrative Mathematics: 6.rp Overlapping Squares
Students use ratio and rate to answer this performance task: The data transfer rate of an Internet connection is the rate in bytes per second that a file can be transmitted across the connection. Data transfer is typically measured in...
Rice University
Rice University: The Chi Squared Goodness of Fit Test
This discussion of the chi-squared goodness-of-fit test for statistical data also includes an example and a link to a critical values tables.
Other
Stat Soft: Statistics Glossary
Dozens of statistical terms are defined and illustrated in this glossary.
Physics Aviary
Physics Aviary: Quick Graphing/linearizing Program
This program was designed as a quick graphing program that students could use on a computer, tablet or smart phone when a more complex graphing program is not available. This program will let students plot up to 10 data points and then...
Texas Instruments
Texas Instruments: Numb3 Rs: Candy Land
Based off of the hit television show NUMB3RS, this lesson introduces students to the chi-squared statistical analysis. Although not completely in depth, the lesson does expose students to degrees of freedom, a simple chi-squared formula,...
State University of New York
State University of New York: The Classius Clapyron Equation
The Classius-Clapyron equation can be used to determine the enthalpy of vaporization from vapor pressure measurements over a range of temperatures. In this simulation students are asked to create the appropriate plot of the data and use...


