Curated OER
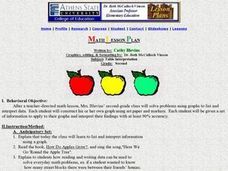
Table Interpretation
Students solve problems using graphs to list and interpret data. Each student construct his or her own graph using art paper and markers. They be given a set of information to apply to their graphs and interpret their findings.
Curated OER
Rain Formation
First graders investigate the different water formations by conducting an experiment. In this water properties lesson, 1st graders examine jars filled with ice, rain water, air and snow in their class. Students predict what will happen...
Curated OER
Discovering Magnets and Graphs
Sixth graders investigate averages and statistics by discovering magnet strengths. In this magnet experiment lesson, 6th graders utilize different magnets and attempt to attract different materials to them. Students record the...
Core Knowledge Foundation
First Grade Skills Unit 5
Twenty-two lessons make up a unit that focuses on first-grade skills. Scholars examine spelling alternatives—their rules and patterns, practice tricky spelling and high-frequency words, explore plural nouns and sentences, read a...
Curated OER
Organizing and Interpreting Data
In this organizing and interpreting data worksheet, students solve and complete 10 different problems related to reading various data tables. First, they complete the 3 charts shown with the correct tally amount, frequency amount, and...
Curated OER
Cricket Weather
In this collecting data worksheet, 4th graders use the data collected on crickets chirps and the temperature to make a line graph by following 4 directives.
Curated OER
Virtual Field Trip: Lesson Ten - Publishing
Class members publish a letter describing their Virtual Field Trip incorporating data from previously developed charts, graphs, and data tables. The final lesson in a series devoted to collecting information and publishing data.
Curated OER
Weather instruments
Students explore weather instruments. In this weather lesson, students make rain gauges, anemometers, and barometers following the instructions given in the lesson. Students set up a weather station using their instruments and record and...
Curated OER
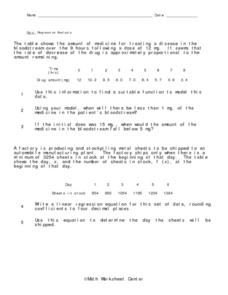
Regression Analysis
In this regression analysis worksheet, 9th graders solve 10 different word problems related to regression analysis. First, they use the information given to find a suitable function to model the data. Then, students use the model to...
University of North Carolina
Statistics
Let's see you back it up! As shown in the 18th handout in the Writing the Paper series of 24 lessons from UNC, statistics help form an effective argument. The handout discusses how to analyze a source and break down the data to ensure it...
Curated OER
Facts on Fish Species
Here is a brief outline of facts on various Chesapeake Bay fish species. Use it as an example of what kind of information you want your life science learners to collect when you assign them a specific species to research. Another way to...
Curated OER
Graphing Family Reading Habits
Second graders collect data from their families about their reading habits and graph them. For this graphing family reading habits lesson, 2nd graders interview family members about their reading habits. They then use a graphing computer...
Curated OER
Angles and Arcs
In this angles and arcs activity, 10th graders solve 18 various types of problems related to determine various angles and arcs of a circle. First, they find the measure of each angle and arc of the first circle shown. Then, students...
Curated OER
An Inventory of My Traits
In this biology activity, students identify and describe a number of easily observable genetic traits and compare the traits they have with other students. Then they identify and describe that some traits are common while others are not...
Curated OER
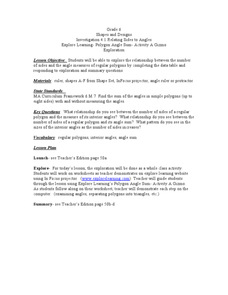
Shapes and Designs
For this shapes and designs worksheet, 10th graders solve and complete 6 different types of problems. First, they fill in the first two columns of the table show with their shapes. Then, students measure the interior angles of each...
Curated OER
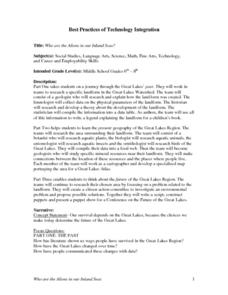
Who Are the Aliens in Our Inland Seas?
Students work in teams to research specific landforms in Great Lakes Watershed, compile information into data table, and write legend explaining landform for children's book. Students then research area surrounding landform, compile...
Curated OER
DNA, RNA, Protein Synthesis, & Mutation
In this biology worksheet, students identify and label the diagram shown by stating what each part of the diagram represents on the line. Then they use the DNA strand as the original strand and complete the data table. Students also...
Curated OER
Microsoft Access Lesson Plan
Third graders read children's literature during the school year and compile a list of books and genres in an Access database. They print out a report of all the different books and genres of they read over the whole school year.
Curated OER
The Guise of a Graph Gumshoe
Eighth graders practice constructing bar, circle, and box-and-whisker graphs. They practice reading and interpreting data displays and explore how different displays of data can lead to different interpretations.
Curated OER
Graphic Favorite Breakfast Foods
Second graders graph data based on a class survey of their favorite breakfast foods. For this graphing lesson plan, 2nd graders take a class survey of their favorite breakfast foods. Then they take that data and put it into a computer...
Curated OER
Confusing Colors!
Fourth graders collect data, graph their data, and then make predictions based upon their findings. They's interest is maintained by the interesting way the data is collected. The data collection experiment is from the psychology work of...
Curated OER
Central Tendencies and Normal Distribution Curve
Fourth graders are given data (class test scores) to determine central tendencies, and find information needed to construct a normal distribution curve. They become proficient in calculating mode, median and average.
Curated OER
A Closer look at Oil and Energy Consumption
Upper graders analyze basic concepts about the consumption, importation and exportation of the worlds oil production. They create several graphs to organize the data and draw conclusions about the overall use of oil in the world.
Curated OER
Pen Pals
Students collect bird count data at their sites, and share and compare the data collected from two different schoolyards using computer technology.
Other popular searches
- Data Tables
- Data Displays
- Displaying Data
- Create Data Table
- Data Table and Graph
- Creating Data Tables
- Science Data Tables
- Creating a Data Table
- Making Data Tables
- Organizing Data in Tables
- Solar System Data Table
- Data Tables and Graphing


