Curated OER
Designing Models to Simulate Actual Events Using a Table of Random Digits
Students design models to simulate actual events using a tale of random digits. They estimate the likelihood of a particular outcome using results of simulation. Students investigate the uses of statistical methods to analyze data.
Curated OER
Graphing Data
Second graders examine how to make and read bar graphs. For this bar graph lesson, 2nd graders compare bar graphs to pictographs by looking at hair color survey data. They practice making a bar graph and finding the range of the data.
Curated OER
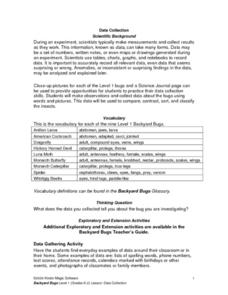
Science: Backyard Bugs Data Collection
Students practice data collection skills by observing common bugs found in their local environment. Once the data is collected they complete data sheets to compare, contrast, sort, and classify the insects. The instructional activity...
Curated OER
Thinking Systematically
Sixth graders solve real life mathematics problems. After reading a given problem, 6th graders gather and organize data into a table. They explore a pattern, and from this, derive a formula. Students solve the problems multiple ways...
Curated OER
??Discovering Patterns and Trends of the Periodic Table using PDAs??
In this lesson, 10th graders research the elements within a particular period of the periodic table of elements. Students gather data from PDA for each element and join other individuals to decpher the patterns in the peridoc table.
Curated OER
Analysis of Colonial History: Shipbuilding in Nova Scotia, 1861
Eighth graders use a web-site to examine the economic factors involving colonial ship- building. In this shipbuilding lesson, 8th graders will build a set of tables that demonstrate how they have chosen to analyze cost, processing...
Curated OER
Periodic Table Lesson Plan
Pupils describe how elements are arranged on the periodic table. They compare metals, nonmetals, and metalloids based on their properties and on their locations in the periodic table. Students describe the differences between a period...
Curated OER
Barrier Islands
Third graders explore how barrier islands work. In this erosion lesson, 3rd graders create barrier islands in stream tables and simulate wave action to see how it affects their island.
Curated OER
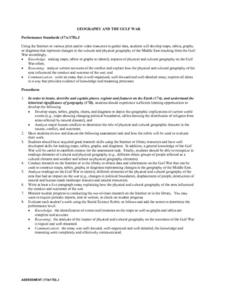
Geography And The Gulf War
Students develop maps, tables, graphs, charts, and diagrams to depict the geographic implications of current world events, and analyze major human conflicts to determine the role of physical and cultural geographic features in the...
Curated OER
Making Sounds
Students perform three experiments to gain understanding of how pitch changes. In this sound lesson, students create a variety of sounds with different pitches. Students will record their data as the observe the differences in the sounds...
Curated OER
Mine Shaft Grade 8 Slope
Eighth graders investigate slopes using real life scenario. In this algebra lesson, 8th graders model and interpret real life data. They plot their data in a coordinate plane and discuss the results with the class.
Curated OER
FOLLOW THAT WATER
Students build simple stream tables and vary the angle of the stream tables in order to simulate different flow rates and compare the results. They observe various features formed in a stream table by flowing water and compare these to...
Curated OER
It'll Go With the Flow...
High schoolers construct a water table elevation contour map and consider the direction and rate of groundwater flow to predict the actual runoff pattern. They discuss their findings and evaluate a hypothetical landfill site based on...
Curated OER
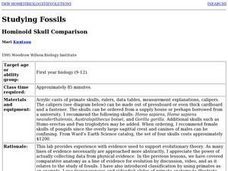
Studying Fossils: Hominoid Skull Comparison
High schoolers collect data on the differences in Hominid skulls using acrylic casts of fossil skulls. They measure a series of structures on skulls from six different species then use the data to determine evolutionary relationships...
Curated OER
The Apple Orchard Problem
Students explore various approaches to solving a problem of maximizing the total production of apples in an orchard. In this apple orchard instructional activity, students collect data in order to solve the apple orchard problem...
Curated OER
Give Me Some Sugar, Honey!
Students research the history of honey and different products that come from honey. In this bees and honey lesson, students review how honey is made, discuss ways people use honey, research the history of honey and its uses, create...
Curated OER
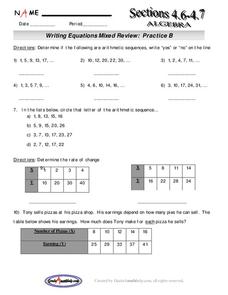
Writing Equations Mixed Review
Students write equations based on a pattern. In this algebra lesson, students calculate the arithmetic and geometric mean of a sequence. They rewrite word problems as a linear equation and solve real life scenario based on the given data.
Curated OER
Our Neighborhood in the Milky Way
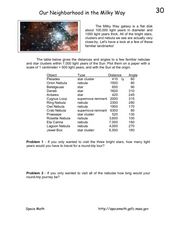
In this Milky Way galaxy worksheet, students are given a table of distances and angles of nebulae and star clusters from the sun. Students plot each one on a piece of paper and solve 2 problems using the data.
Curated OER
TI-Nspire Activity: What Does Your Representation Tell You?
By learning to select the best representation for three meal plans, students compare three meal plans to determine the best choice. Data for the meal plans is sorted on a table, as an algebraic equation, and graphed on a coordinate grid....
Curated OER
The Motivation for Movement
Students explore the geographic theme of movement. In this migration lesson, students discuss push-pull factors that motivate immigrants and interpret illegal immigration data. Students also discuss the difficulties that illegals face.
Curated OER
T's Alive! Or Is It?
Students explore data on the bone, muscle, and skin of living systems and then create a list of characteristics of these systems and relate these characteristics to bone, muscle, and skin.
Curated OER
1928 Flu
Students state the some diseases are the result of infection. They describe the risks associated with biological hazards, such as viruses. Pupils name ways that infectious disease can be prevented, controlled, or cured. Students...
Curated OER
Osmosis Investigation
Students investigate osmosis as they determine how carrot cells respond to two different environments. They conduct the experiment, record the data, and answer discussion questions.
Curated OER
Can We Be Both Conservationists and Consumers?
Students explore their role as consumers and conservationists and what roles they play in today's economic climate. They explore resource allocation issues. Students analyze data and draw comparisons between historical and present-day...
Other popular searches
- Data Tables
- Data Displays
- Displaying Data
- Create Data Table
- Data Table and Graph
- Creating Data Tables
- Science Data Tables
- Creating a Data Table
- Making Data Tables
- Organizing Data in Tables
- Solar System Data Table
- Data Tables and Graphing


