Royal Society of Chemistry
Royal Society of Chemistry: The Periodic Table of Data
An interactive Periodic Table of Elements which also serves as a visual database of each element's physical and thermochemical properties. Online activities include virtual graphing, tables of data, energy level diagrams, games, and more.
Other
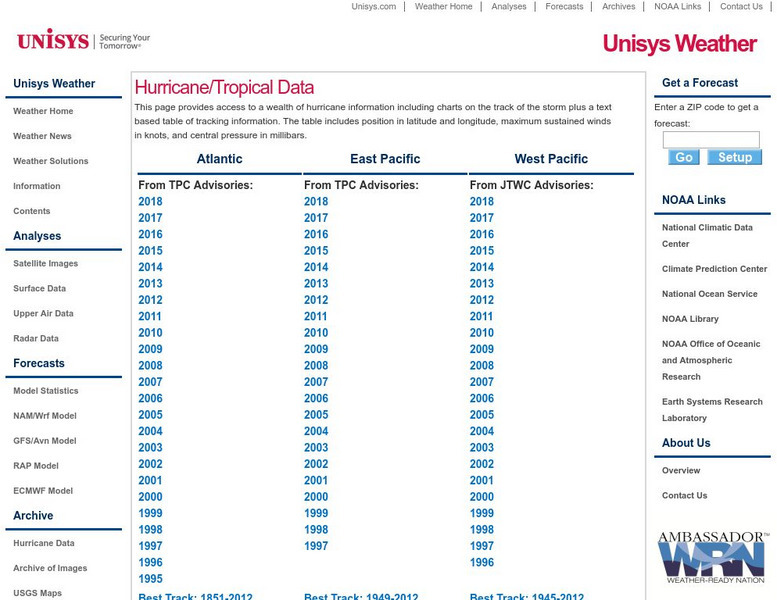
Unisys: Hurricanes/tropical Data
There is a table that has links to hurricanes in the Atlantic from 1995, East Pacific from 1997, West Pacific from 1996, South Pacific from 2000, and South India from 2000. This page has a satellite map and the Saffir-Simpson Scale.
Federal Bureau of Investigation
Fbi: Crime in the United States 2012: Table 43: Arrests by Race, 2012
Three tables of arrest statistics in the United States for 2012. The types of offenses committed are listed, and the ethnic information for the perpetrators. The first table shows all the data. The second one shows data for arrests of...
Other
Brebeuf Jesuit Preparatory School: The Scientific Method (Part 3) [Pdf]
Explains how to collect and organize data for an experiment. Describes how to make a table and graph the data, and when to use different types of graphs. Next, it discusses which variable should be on the x- or y-axis of a graph, and how...
Texas Education Agency
Texas Gateway: Ap Physics I: Appendices: Useful Information
This page provides eight tables of useful information such as Important Constants, Submicroscopic Masses, Solar System Data, Metric Prefixes for Powers of Ten and Their Symbols, The Greek Alphabet, SI units, Useful Formulae, and other...
Sophia Learning
Sophia: Finding Rates of Change From Tabular Data: Lesson 3
This lesson demonstrates how to find the rate of change from a given table of data. It is 3 of 5 in the series titled "Finding Rates of Change from Tabular Data."
Sophia Learning
Sophia: Slope Intercept Form From Tabular Data: Lesson 2
This lesson demonstrates how to find the slope-intercept form of a linear function when given a table of data. It is 2 of 4 in the series titled "Slope Intercept Form From Tabular Data."
Sophia Learning
Sophia: Slope Intercept Form From Tabular Data: Lesson 4
This lesson demonstrates how to find the slope-intercept form of a linear function when given a table of data. It is 4 of 4 in the series titled "Slope Intercept Form From Tabular Data."
Other
Population Reference Bureau: The World at 7 Billion
This interactive map offers statistical data on population, birth and deaths, life expectancy, HIV/AIDS, family planning, and poverty across the world in 2011. The information is also available as a table for all topics. A fascinating...
Palomar Community College District
Palomar College: Behavioral Science Statistics: Cumulative Percent Polygon
A step-by-step worked problem demonstrating how to take a set of data and produce a cumulative percent polygon. Hints are provided along the way, and the final graph is shown for the user to check.
US Census Bureau
U.s. Census Bureau: Quick Facts: Jacksonville City, Florida
Quick facts from the most recent census data for Jacksonville, Florida. More detailed information is available through a the 'Select a Fact' pulldown menu above the table. The data can be downloaded in Excel or text format.
PBS
Pbs Teachers: Weather: Rainfall
Create and use scatterplots based on information from a table, and compare and contrast annual rainfall in various places around the world.
Tom Richey
Linked in Learning: Inherited Traits
Use this slideshow to teach your class the difference between inherited and learned traits. Includes a survey of traits, a data table, a chart with examples of inherited traits, and questions to spur engagement and discussion.
Other
Texas.com: Texas Demographics
Tables using 2000 U.S. Census Bureau data showing the makeup of the Texas population, and housing, economic, and education characteristics of Texas.
NASA
Nasa: Mars Planet Profile
This site has a data table of statistical information about Mars. Among the things listed are density, diameter, distance from the Sun, and much more.
Other
California State University: Carboxylic Acid Unknown Candidates
Table of names, formulas, and physical data on many orgainc acids.
Federal Reserve Bank
Federal Reserve Bank of St. Louis: M2 Money Stock Seasonally Adjusted
This site from the Federal Reserve Bank of St. Louis provides a table showing the M2 money stock from 1959 to the present.
Curated OER
[Bohr Model of Actinium]
A nice set of data tables on actinium and its properties, along with isotopic data. Clearly presented.
Other popular searches
- Data Tables
- Data Displays
- Displaying Data
- Create Data Table
- Data Table and Graph
- Creating Data Tables
- Science Data Tables
- Creating a Data Table
- Making Data Tables
- Organizing Data in Tables
- Solar System Data Table
- Data Tables and Graphing


