Curated OER
Data Collection and Presentation
Students concentrate on discrete quantiative data. They are shown that the vertical line diagram as a more appropriate way to present discrete quantiative data then bar charts. Students work as a group to help with the interpretation...
Curated OER
Dealing With Data
Students collect, organize, and display data using a bar graph, line graph, pie graph, or picture graph. They write a summary describing the data represented and compare the graph to another graph in the class.
Curated OER
Making a Bar Graph
In this bar graph worksheet, students analyze a data table and bar graph depicting information about stickers collected. Students answer 5 questions about the data displayed.
Curated OER
Function Tables
In this function tables worksheet, students analyze 6 different function tables to determine the rule that applies to each table. The data in the table involves 2 variables and the rule is either addition, subtraction, multiplication...
Curated OER
Arthropod Data Collection
Students describe the life cycle of various bugs as well as their predators and feeding habits. The class participates in a discussion of the various methods scientists use to gather data including research and experiment. After...
Curated OER
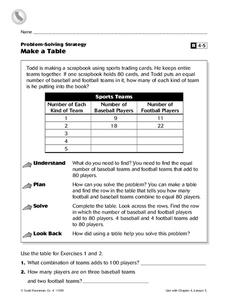
Make a Table
For this charting worksheet, 4th graders complete a table. Using the information provided, students fill in the missing data and complete 2 short answer questions.
Curated OER
My Test Book: Standard Form and Reading Tables
In this math skills worksheet, students solve 10 multiple choice math problems that require them to write numbers in standard form and read tables. Students may view the correct answers.
Curated OER
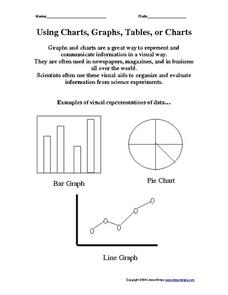
Using Charts, Graphs, Tables, or Charts
In this charts, graphs and tables learning exercise, students view 3 different types of visual representations of data, make a list of 20 items and decide how the items can best be put together in groups to make a graph, chart or table....
Curated OER
Frequency Histograms, Bar Graphs and Tables #3
In this frequency histograms instructional activity, students examine bar graphs, histograms and tables. They identify the model of information that best matches the statistics. This three-page instructional activity cotnains...
Curated OER
Proportionality in Tables, Graphs, and Equations
Learners create different methods to analyze their data. In this algebra lesson, students differentiate between proportion and non-proportional graph. They use the TI-Navigator to create the graphs and move them around to make their...
Curated OER
Data Analysis, Probability, and Discrete Mathematics: Lesson 4
Eighth graders investigate the concepts of probability while performing data analysis. They apply statistical methods in order to measure or predict some possible outcomes. The information is collected and graphed, 8th graders analyze...
Curated OER
Collecting Data
In this data collection worksheet, students read about how data is collected and organized. They also learn about a hypothesis. Students read through examples of different charts and then answer 23 questions pertaining to data...
Curated OER
Recording Data From a Survey Reteaching Worksheet
In this recording data from a surveys reteaching worksheet, 2nd graders review the use of tallies when recording data. They use the information to make a data table and a bar graph that displays the information.
Curated OER
Table Readings
In this table worksheet, students read questions and interpret tables. Questions include information concerning unemployment, oil imports, and foreign students. This multiple-choice worksheet contains 10 problems. ...
Curated OER
Data Analysis 2
In this data analysis learning exercise, students read and interpret given line graphs. They determine the range and average. This one-page learning exercise contains five problems.
Curated OER
Challenge Time Problems
In this time problems worksheet, 8th graders solve and complete 6 different problems that include filling in data and responding to short answer questions about time. First, they determine the number of hours each child in the table...
Curated OER
Double Bar Graphs (Reteach 15.1)
In this graphs worksheet, students analyze the data on two double bar graphs. Students answer 4 questions about the information on the graphs.
Curated OER
Froot Loops to the Max - Predictions and Weighing
In this prediction and weighing worksheet, middle schoolers complete and solve 5 problems related to a box of Froot Loops cereal. First, they complete the table with the data each team finds with their box of cereal. Students determine...
Curated OER
What's Up With My Class
Learners collect data about their class and they use Excel spreadsheet to display their tables and graphs about the class. They answer survey questions and collect their data. Students create a graph of their choice to display the...
Curated OER
kind of Bean
Third graders sort different types of beans and collect the data. They create a data table, put the information on the data table and then graph their results. They answer follow-up questions.
Curated OER
Canada at a Glance
Stjudents examine the statistics in a Canadian publication for use in graphs. They develop their own questions based on tables and graphs found in this publication..
Curated OER
Statistics of Mars
Students explore the concept of central tendencies. In this central tendencies lesson, students sort M&M's or Skittles based on color. Students graph their results. Students find the mean, median, and mode of their data.
Curated OER
Credit Cards: The Good, the Bad, and the ugly
Students study how dangerous credit cards can be. They see why it is important to pay off credit card bills as soon as they can. They use MS Excel to display and understand the data. They fill out questions using the data from their...
Curated OER
Graphs: All About Our Class
Students respond to survey questions, discuss results, brainstorm ways to represent survey information, and create table of class results. They find mean, range, and percentages, and create graph to display results.
Other popular searches
- Creating Data Tables
- Science Data Tables
- Making Data Tables
- Organizing Data in Tables
- Data Tables and Graphing
- Graphs and Data Tables
- Data Tables and Charts
- Create Data Tables From Graphs
- Data Tables Lesson Plans
- Data Tables Surveys
- Pocket Data Tables
- Using Data Displays


