Curated OER
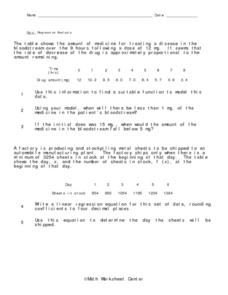
Regression Analysis
In this regression analysis activity, 9th graders solve 10 different word problems related to regression analysis. First, they use the information given to find a suitable function to model the data. Then, students use the model to...
Curated OER
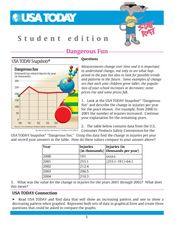
Dangerous Fun
For this line graph worksheet, students analyze the data on a graph about toy-related injuries by year. Students solve 5 problems in which the change in injuries per year is calculated and recorded on a table.
Curated OER
Using a Spreadsheet
Students create a spreadsheet to analyze data. In this technology lesson, students develop and use an Excel spreadsheet to log their data. They solve real life word problems as they set it up using the spreadsheet.
Curated OER
Global Statistics
Students select appropriate data to determine the mean, median, mode and range of a set of data. They calculate the statistical data on literacy rates and life expectancy within each geographic region of the world. Students determine...
Curated OER
Harry Potter Research Project
Students work together to complete a research project on Harry Potter. They write a research question and develop a survey to give to their classmates. Using the results, they create a graph and draw conclusions about the data collected.
Curated OER
Variables and Patterns: Determining an appropriate scale while graphing
Sixth graders determine appropriate scales when graphing data. In this graphing lesson, 6th graders use an the applet "Graph It" to determine what is an appropriate scale for their data.
Curated OER
Rocketsmania And Slope
Learners use a professional basketball team's data and graph it on a coordinate plane. They draw a line of regression and finding its equation. They access a website containing statistics for the Houston Rockets basketball team to solve...
Curated OER
Mr. Cobbler's Shoe Dilemma
Middle schoolers employ statistics to solve real-world problems. They collect, organize and describe data. They make inferences based on data analysis. They construct, read, and interpret tables, charts and graphs.
Curated OER
Building Storm Shelters
Sixth graders explore area and perimeter. In this online interactive area and perimeter lesson, 6th graders investigate why the perimeter of rectangles can vary considerably even when the area is held constant. Students construct...
Curated OER
Putting Your Money to Work
Students create a collect data on expenses. In this algebra lesson, students create a spreadsheet to solve scientific equations. They incorporate math, science and technology in this lesson.
Curated OER
Exploring Function Graphs
Tenth graders investigate three different sets of data that relate temperature to another variable in the physical world. These illustrate linear, inverse and exponential relationships.
Curated OER
Putting Your Best Foot Forward
Third graders measure their feet and their parents' feet, record data on computer-generated graphs, and calculate and record mean, median, and mode.
Curated OER
What Are The Chances
Students calculate the probability of an event occurring. In this probability instructional activity, students differentiate between independent, dependent or compound events. They find the range of the data.
Curated OER
Integration: Statistics, Scatter Plots and Best-Fit Lines
In this math worksheet, students identify the type (if any) of correlation on 6 scatter plots. They use information given on a table to create a scatter plot and identify the type of correlation. Students use the scatter plot to make...
Curated OER
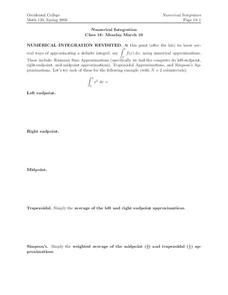
Numerical Integration
For this math worksheet, students practice using the number approximations to apply them to the integrations. They compare the numerical methods and graph the results in the data table.
Curated OER
Median and Mode
In this median/mode worksheet, students solve 6 problems, using a table of students and their heights in centimeters. Students find median, mode, outliers and arrange data from least to greatest.
Curated OER
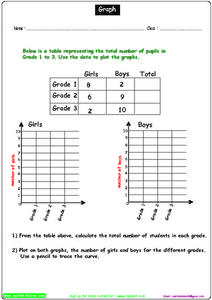
Graph Activity
In this graphing learning exercise, students complete a data table, then use the data to draw a set of 2 graphs, calculate totals and plot numbers on both graphs.
Curated OER
The Coyote Population: Kansas Prairies
Students discover animal lifestyles by researching their ecosystem. In this animal statistics lesson, students research the geography of Kansas and discuss the reasons why wild animals survive in the open Kansas fields. Students complete...
Curated OER
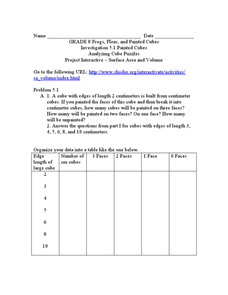
Analyzing Cubes
In this analyzing cubes worksheet, 9th graders solve and complete 6 different types of problems. First, they organize the given data into the table provided. Then, students study the patterns in the table and tell whether the pattern of...
Curated OER
Scatter Plots
In this scatter plots worksheet, students solve and complete 4 different problems. First, they use the table shown to model the relation with a scatter plot and trend line and to predict the value of a variable when given the other...
Curated OER
Childhood Obesity
Students identify a question to generate appropriate data and predict results. They distinguish between a total population and a sample and use a variety of methods to collect and record data. Students create classifications and ranges...
Curated OER
Trends of Snow Cover and Temperature in Alaska
Students compare NASA satellite data observations with student surface measurements of snow cover and temperature. They practice data collection, data correlations, and making scientific predictions.
Curated OER
Weather Watchers
Students collect and analyze data about the weather. For this algebra lesson, students organize and graph their data using graphs, line plots and stem and leaf plots. They make observation and draw conclusion using their data.
Curated OER
Move It
Studens collect and graph data. In this algebra lesson, young scholars use a CBL and CBR with a TI Calcualtor to observe linear graphs. They use the correct vocabualry as they discuss the collected data.
Other popular searches
- Creating Data Tables
- Science Data Tables
- Making Data Tables
- Organizing Data in Tables
- Data Tables and Graphing
- Graphs and Data Tables
- Data Tables and Charts
- Create Data Tables From Graphs
- Data Tables Lesson Plans
- Data Tables Surveys
- Pocket Data Tables
- Using Data Displays


