Curated OER
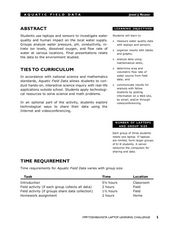
Aquatic Field Data
Young scholars use laptops and sensors to measure water quality and graph their results. In this aquatics lesson plan students post their results to a website or email.
Curated OER
Drip, Drip, Drip or The Case of the Leaky Faucet
Students explore the cost of wasted water. In this math lesson, students conduct an experiment in which they collect data on how much water is lost when a faucet leaks. Students figure the cost of the water that was wasted.
Curated OER
Counting
Second graders comprehend how to use two different kinds of graphs. They complete a worksheet with the help of the teacher and a bag of jellybeans and then another worksheet without the direction of the teacher. Students listen as the...
Curated OER
Canada Recycles! Do You?: Grades 4-6
In this recycling education worksheet, students read a table regarding Canadian recycling statistics and respond to 9 questions regarding the data.
Curated OER
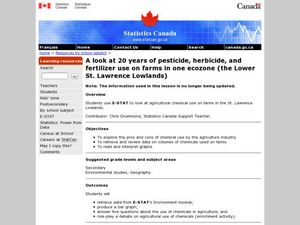
Effects of chemical use in Agriculture
Students research environmental data to create a bar graph. For this agricultural ecology lesson, students research the pros and cons of chemical use in farming. Students debate on passing a law to reduce chemical use.
Curated OER
Math for Fourth Grade: Statistical Charts
In this math for fourth grade statistical charts activity, 4th graders answer 7 multiple choice questions in standardized test format about data, charts and graphs.
Curated OER
Favourite Colours
For this colors worksheet, students survey 20 people on what their favorite color is. They mark the results using tallies. Students then take their data and put the totals in a frequency table.
Curated OER
Cereal Box Blocks and More!
Students sort and categorize different types of boxes and cartons. In this sorting lesson, students designate areas of the room to put different sizes, styles, or colors of boxes. They help their teacher count and graph the different...
Curated OER
Marvelous Mathematics
Students make a table on the computer, but create fractions and equivalent fractions through the use of color. They are able to manipulate fractions in order to gain a greater understanding of the meaning of whole number that is broken...
Curated OER
Variation
In this variation worksheet, students interpret and organize data. They find the distance between points. Students use ratios to determine volume This six-page worksheet contains approximately 20 problems. Answers...
Curated OER
Paws in Jobland: Lesson Plan 35 - Catch of the Day
Young scholars study information for fish farm workers given in the form of a chart, in order to practice interpreting data while learning about the career of a fisherman. In this data interpretation lesson, students read the chart to...
Curated OER
Probing Under the Surface
Eighth graders use a measuring stick to determine the shape of the inside of the bottom of a box, then apply their knowledge to an additional situation. This task assesses students' abilities to make simple observations, collect and...
Curated OER
Exponential Functions
In this algebra worksheet, students evaluate exponential functions using tables and graphs. There are 6 questions with an answer key.
Curated OER
How Long? How Wide?
Second graders distinguish between and use nonstandard and standard units of measurement, use appropriate tools and techniques to measure length and width, and record and interpret data using graphs.
Curated OER
RIP M&M's
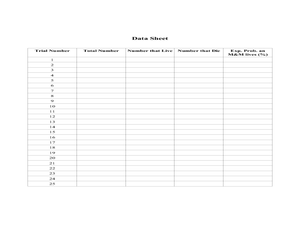
Students solve theoretical probability problems. In this algebra lesson, students apply the concept of probabilities to solving real life scenarios. They collect data and graph it using experimental probability.
Curated OER
What's A Water Column Profile?
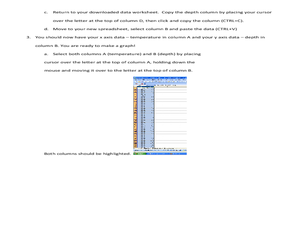
Students investigate water column data. In this earth science and seawater lesson, students determine how temperature, salinity, and density have an impact on sea water by viewing and analyzing data obtained from a number of websites....
Curated OER
What's in the Water?
Fifth graders use the dots to simulate water pollutants in a lake. They use cups to collect a sample of "water." Students sort the dots by color and record the number of each dot color under the correct pollutant name in the Lake Water...
Curated OER
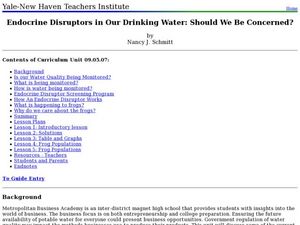
Endocrine Disruptors in Our Drinking Water: Should We Be Concerned?
Students investigate the different hormone contaminants in the water supply. In this math lesson, students analyze data tables and graphs. They demonstrate exponential growth and decay using frog populations.
Curated OER
Freshman Project-Part 6-Final Written Report
In this project worksheet, students complete a formal write up of their experiments. This includes a rationale, a purpose, a hypothesis, their experimental design, materials, procedure, data tables with variables, graphs and a concluding...
Curated OER
Basketball And Mathematics
Eighth graders collect and analyze data about foul shots taken at basketball games.
Pennsylvania Department of Education
Eye to Eye
Students practice the concept of posing mathematical questions regarding themselves and their surroundings. In this eye to eye lesson, students gather data about eye color from their classmates. Students organize their data in order to...
Discovery Education
Sonar & Echolocation
A well-designed, comprehensive, and attractive slide show supports direct instruction on how sonar and echolocation work. Contained within the slides are links to interactive websites and instructions for using apps on a mobile device to...
University of Georgia
Endothermic and Exothermic Reactions
Equip your chemistry class with the tools to properly understand endothermic and exothermic reactions. Young chemists collect, analyze, and graph data to determine how the Law of Conservation of Matter is applied to chemical...
Curated OER
Math Investigations 2
Young mathematicians practice measuring and graphing skills while working in groups to measure objects found in the classroom. Using their measurements, they create one bar graph displaying the lengths and another displaying the widths.
