Other
Nearpod: Displaying Data: Dot Plots
In this lesson, students will learn how to create and intrepret dot plots.
Other
Nearpod: Displaying Data: Box Plots
In this instructional activity, students will learn how to create and intrepret box plots using the 5-number summary.
Texas Instruments
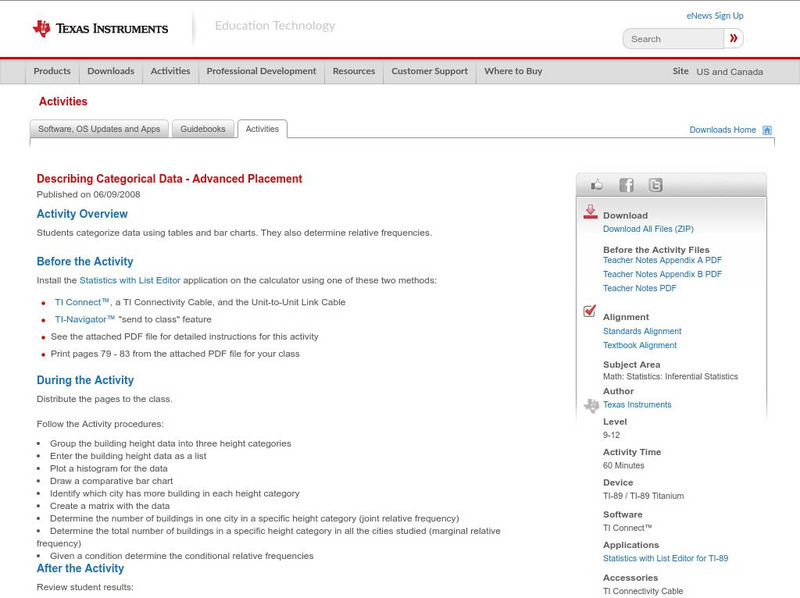
Texas Instruments: Describing Categorical Data Advanced Placement
Students categorize data using tables and bar charts. They also determine relative frequencies.
National Council of Teachers of Mathematics
The Math Forum: Seventh Grade Mathematics: Data Sense
This site has some interesting ways to collect and evaluate data. There are some activities about note taking, spreadsheets, surveys, and a cool bridge construction project. Teachers may want to use this site as a resource for some...
Google
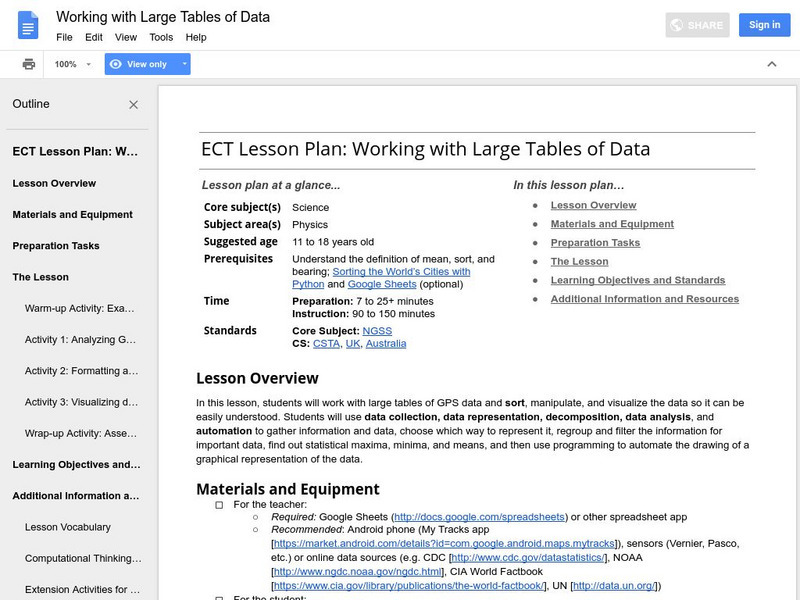
Google for Education: Working With Large Tables of Data
Students work with large tables of GPS data and sort, manipulate, and visualize the data so it can be easily understood.
Google
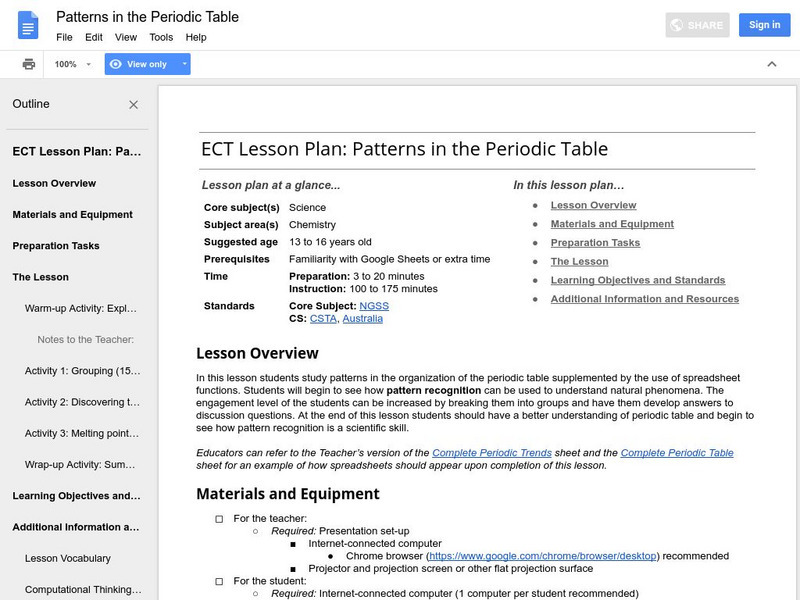
Google for Education: Patterns in the Periodic Table
Students study trends in the periodic table of elements, supplemented by the use of spreadsheet functions. The spreadsheet functions presented can be used on any data set.
Science Education Resource Center at Carleton College
Serc: Mn Step: Statistical Analysis of Lincoln
For this activity, young scholars first work in groups to collect information about a set of pennies. They measure and record the mass for each one in a table using a spreadsheet program if possible. They also record its year and, for...
Alabama Learning Exchange
Alex: Who Wants to Know the Periodic Table?
The purpose of the project is to help the learners gain an in depth knowledge of the Periodic Table of Elements. The periodic table is the very backbone of chemistry. In order for the students to be successful in chemistry, they must be...
Google
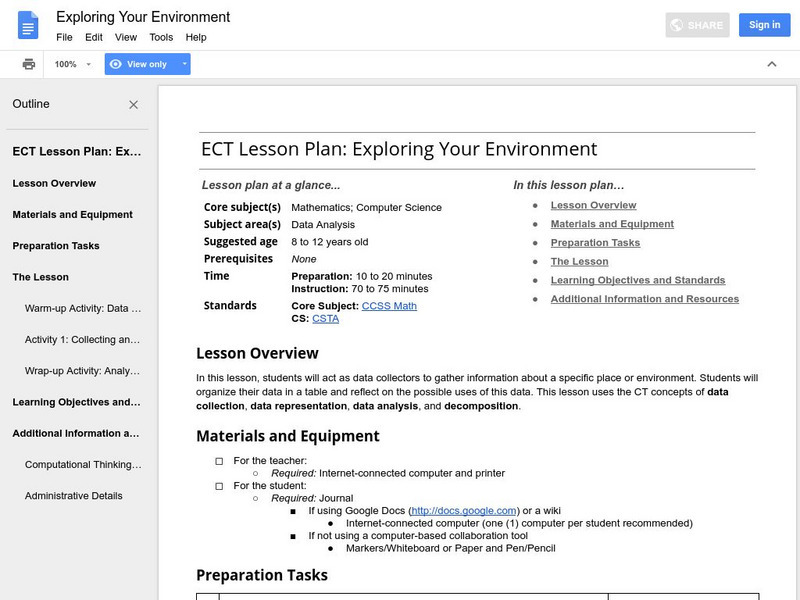
Google for Education: Exploring Your Environment
Students act as data collectors who gather different types of information about various things in the environment. Students then organize the data in a table and reflect on the possible uses of this data.
Alabama Learning Exchange
Alex: Get on Your Mark, Get Set, Go!
In collaborative/cooperative groups, students will review basic vocabulary and concepts for data and statistics. Students will create, collect, display, and interpret data in the form of frequency tables, bar graphs and circle graphs.
Alabama Learning Exchange
Alex: Getting to Know Your Classmates Using Bar Graphs
Middle schoolers will collect data from class using surveys. Students survey classmates concerning favorite movies, favorite color, shoe size, time spent studying, brand of cell phone and etc. From the data they will create bar graphs...
University of Texas at Austin
Mathematics Teks Toolkit: The Sounds of Music
In this lesson, students collect data, graph it, then determine the period and frequency of the sound waves made by a guitar.
Better Lesson
Better Lesson: Going for the Gold
Second graders read and create graphs based on Olympic data for 2014.
Alabama Learning Exchange
Alex: How Long Will It Take?
In this lesson, students will participate in a group activity using a sponge ball and a growing human circle. The students will be added to a circle in groups of two and will pass the sponge ball from hand to hand until it returns to the...
Alabama Learning Exchange
Alex: Who Bounces Best?
This is a cooperative learning, kinesthetic and presentation lesson. Young scholars will use the computer to create graphs/charts to display data collected by counting the number of successful bounces when bouncing a basketball for 30...
University Corporation for Atmospheric Research
Ucar: Drawing Clouds Inside the Lines
In this classroom activity, students investigate how clouds change over time by making repeat observations of a section of sky and then representing their data graphically.
Other
Nearpod: Construct & Interpret Scatter Plots
In this instructional activity on scatter plots, 8th graders will learn how to interpret scatter plots and then graph them using a data table.
Microsoft
Microsoft Education Lesson Plan: Candy Is Dandy
Explore color distribution of M&M candies using this detailed lesson plan. An engaging integrated instructional activity that requires understanding of spreadsheets and formulas, and logical reasoning. Links to related websites.
Science Education Resource Center at Carleton College
Serc: Introductory Concepts in Soil Chemistry
In this introductory lab activity, students will collect data that will graphically illustrate the relationship between mass and volume in determining the density in chemistry. Based on density, students will seek to determine a...
Better Lesson
Better Lesson: Fast Food Freddie Surveys and Bar Graphs
Students continue to build their graphing skills. They experience a real world application of graphing by organizing survey results.
Science Education Resource Center at Carleton College
Serc: Investigating the Ecology of Goldenrod Galls Through Biological Sampling
In this biology field lab exercise, learners conduct a stationary population study of goldenrod galls. They examine a host of factors including goldenrod plant density, goldenrod gall density, gall height, gall mass, larval exit hole...
Google
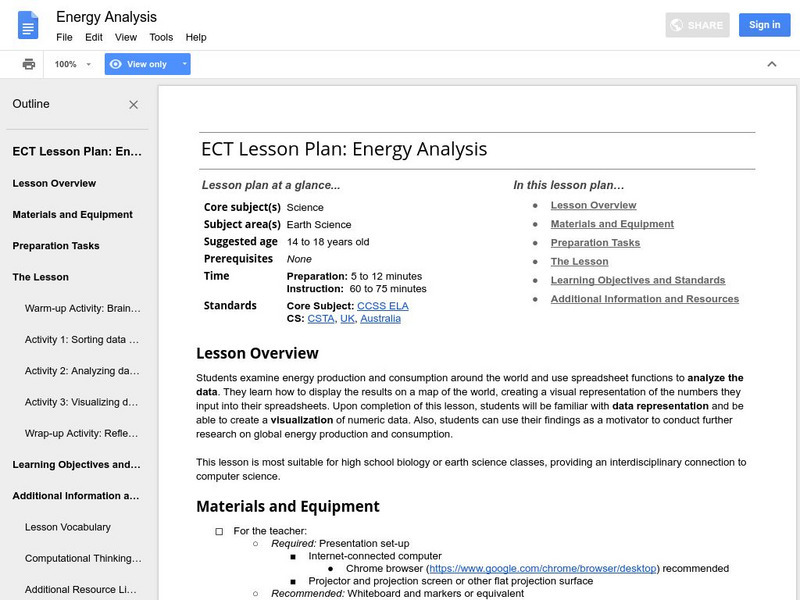
Google for Education: Energy Analysis
Students collect data on energy production and consumption around the world. They input the data into a spreadsheet and use spreadsheet functions to analyze it. Finally, they upload the data into a fusion table to create a visualization.
Science Education Resource Center at Carleton College
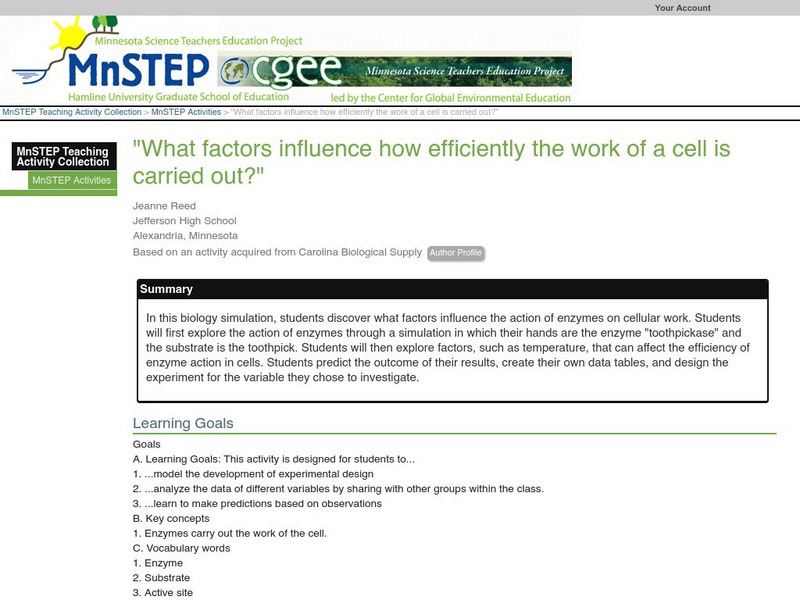
Serc: What Factors Influence How Efficiently the Work of a Cell Is Carried Out?
In this biology simulation, students discover what factors influence the action of enzymes on cellular work. Students will first explore the action of enzymes through a simulation in which their hands are the enzyme "toothpickase" and...
Alabama Learning Exchange
Alex: "Bursting With Math"
Using "Starburst" jelly beans to sort, graph and add.
Other popular searches
- Creating Data Tables
- Science Data Tables
- Making Data Tables
- Organizing Data in Tables
- Data Tables and Graphing
- Graphs and Data Tables
- Data Tables and Charts
- Create Data Tables From Graphs
- Data Tables Lesson Plans
- Data Tables Surveys
- Pocket Data Tables
- Using Data Displays

