Other
The Actuarial Foundation: Play Ball! [Pdf]
Students will understand and apply concepts of data collection, representation, and analysis in a sports context.
Better Lesson
Better Lesson: Class Surveys and Graphs
Learners love graphing data that they "own". In this plan, the class will select a type of graph and create it using a class survey frequency table. Included in this activity are videos of the class engaged in the activity and samples of...
CPALMS
Cpalms: Dollars for Density
This is a guided inquiry activity in which students use simple lab procedures and discussions to develop and apply the concept of density. Students collect and graph data which they use to explore the relationship between mass and...
Scholastic
Scholastic: Bars, Lines, and Pies
Middle schoolers will learn and reinforce skills for creating, applying and analyzing pie charts, bar graphs and line graphs.
Alabama Learning Exchange
Alex: Representing Possibilities
The students will work through problems that will be represented in tables, equations, and graphs. This lesson was adapted from NCTM Student Math Notes, May/June 2007.This lesson plan was created as a result of the Girls Engaged in Math...
Better Lesson
Better Lesson: Using Table Data: Time to the 1/2 Hour
My students have learned how to read and write time. Now I want them to see how important time is for us to organize our lives. I want them to use data charts for schedules and be able to analyze the information.
Illustrative Mathematics
Illustrative Mathematics: F Le in the Billions and Linear Modeling
In this task, learners are shown a table of world population data and asked to explore whether linear functions would be appropriate to model relationships within the data. Aligns with F-LE.A.1.b.
Better Lesson
Better Lesson: Circle Graph Activity
This lesson will allow the student to work through three stations. The stations will focus on creating and analyzing circle graphs. The students will be using technology to create their graphs along with a hands-on activity using M&M's.
Better Lesson
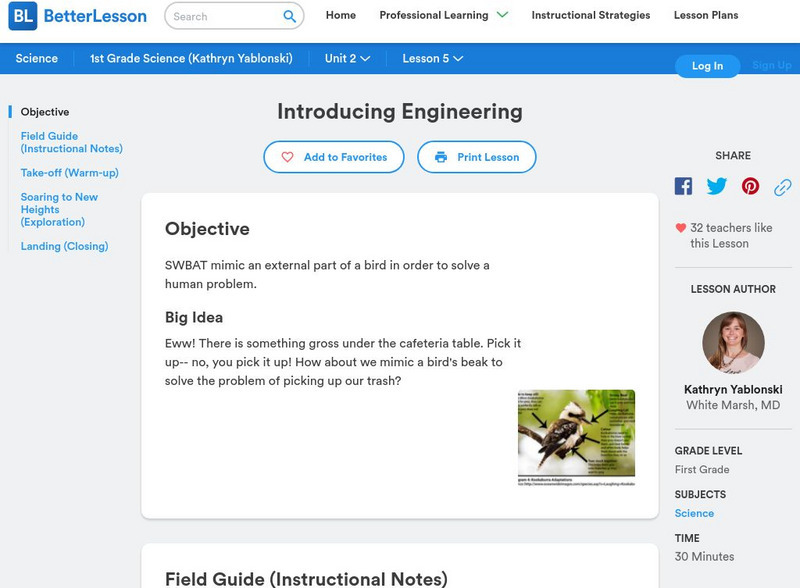
Better Lesson: Introducing Engineering
There is something gross under the cafeteria table. Do you pick it up? Gross! How about we mimic a bird's beak to solve the problem of picking up our trash? This lesson plan models walking through the first few steps of the Engineering...
Alabama Learning Exchange
Alex: My Peanut Butter Is Better Than Yours!
The students will engage in the process of statistical data comparing data using tables and scatterplots. The students will compare data using measures of center (mean and median) and measures of spread (range). This lesson can be done...
Illustrative Mathematics
Illustrative Mathematics: F Le Identifying Functions
In this task, students are shown a table with linear, quadratic, and exponential functions at various values of x and are asked to match the function type to each data set and explain their reasoning. Aligns with F-LE.A.1.b and F-LE.A.1.c.
Other popular searches
- Creating Data Tables
- Science Data Tables
- Making Data Tables
- Organizing Data in Tables
- Data Tables and Graphing
- Graphs and Data Tables
- Data Tables and Charts
- Create Data Tables From Graphs
- Data Tables Lesson Plans
- Data Tables Surveys
- Pocket Data Tables
- Using Data Displays
![The Actuarial Foundation: Play Ball! [Pdf] Lesson Plan The Actuarial Foundation: Play Ball! [Pdf] Lesson Plan](https://d15y2dacu3jp90.cloudfront.net/images/attachment_defaults/resource/large/FPO-knovation.png)


