Hi, what do you want to do?
Curated OER
Graphing Our Favorite Candy Bars
Young scholars use ClarisWorks to graph class' favorite candy bars on a bar graph.
Curated OER
Reading Graphs
Students read graphs and charts to interpret results. In this algebra activity, students interpret bar, line and pictographs. They draw conclusions and make predicitons based on these charts.
Curated OER
Trout In The Classroom
Students have trout in their classroom and complete journaling, checklists, temperature checking, and ammonia level recording. In this trout lesson plan, take weekly observation records of their trout.
Curated OER
A Bird's Eye View of our 50 States
Third graders focus on state birds as they learned absolute location (latitude/longitude) of each state, as well as their relative location (bordering states).
Curated OER
Hey, Look Me Over!
Students make observations about mealworms using hand lenses, rulers, and cotton swabs. Students complete their own mealworm observation chart, then they share their observations with the class. This is one station out of five in an...
Curated OER
Measurement: Using the balance
Students use a balance and gram cubes to measure several different objects. They then record their results on a data chart and answer questions about them.
Curated OER
Do You See What I See?
Students hypothesize the role of rocks, soil, and water by observing a terrarium and create a model to explore the water cycle. This is part of a five station set up.
Curated OER
Up, Up, and Away
Young scholars create a model to explore the water cycle. Students also perform different experiments to witness water changing from a liquid to a gas. Young scholars are asked to if they can find ways for water to go away without...
Curated OER
The Research Paper - Searching for a Subject
Pupils research a website to look for potential topics for a research paper. They develop a narrowed prioritized subject list on an index card (3X5) using word processing program.
Curated OER
Exploring For Copper Deposits
Students examine ore deposits and identify factors in their origin. They analyze geologic maps, and locate porphyry copper deposits on a sediment geochemistry map.
Louisiana Department of Education
Louisiana Doe: Louisiana Believes: Eureka Math Parent Guide: Collecting and Displaying Data
A guide to support parents as they work with their students in collecting and displaying data.
Texas Instruments
Texas Instruments: Mc Dougal Littell Middle School Math: Making Data Displays
Students will create data displays using a scatter plot and a line graph of the data and a circle graph of survey data.
PBS
Pbs Learning Media: Using Data Clusters to Find Hacker
The CyberSquad searches for Hacker's castle based on a survey of where town residents have last seen him in this video from Cyberchase.
Better Lesson
Better Lesson: Class Surveys and Graphs
Students love graphing data that they "own". For this plan, the class will select a type of graph and create it using a class survey frequency table. Included in this lesson are videos of the class engaged in the lesson and samples of...
Better Lesson
Better Lesson: Fast Food Freddie Surveys and Bar Graphs
Students continue to build their graphing skills. They experience a real world application of graphing by organizing survey results.
National Council of Teachers of Mathematics
The Math Forum: Seventh Grade Mathematics: Data Sense
This site has some interesting ways to collect and evaluate data. There are some activities about note taking, spreadsheets, surveys, and a cool bridge construction project. Teachers may want to use this site as a resource for some...
CK-12 Foundation
Ck 12: Statistics: Data Display Choices Grades 6 7
[Free Registration/Login may be required to access all resource tools.] Create surveys and display data using different types of graphs.
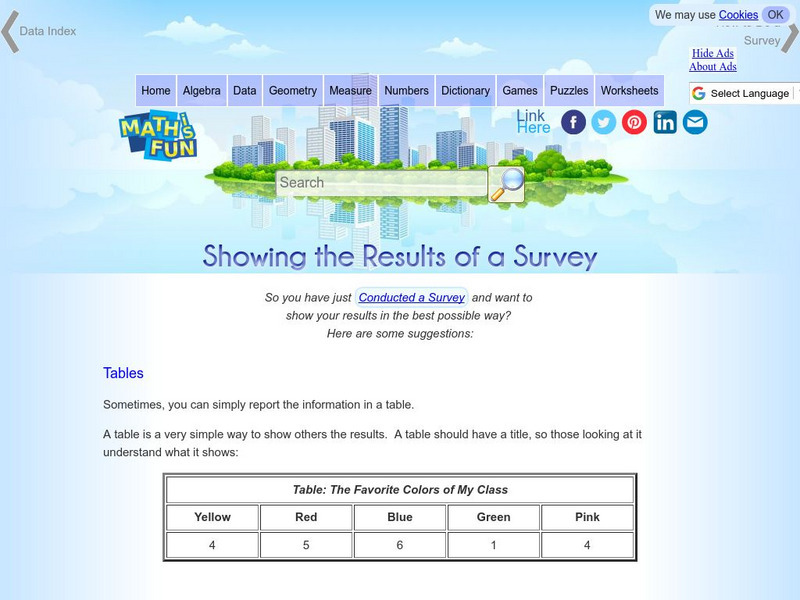
Math Is Fun
Math Is Fun: Showing the Results of a Survey
A variety of ways to display the results of a survey are listed, including tables, statistics and different types of graphs.
Better Lesson
Better Lesson: Reading Tables: What Breakfast Food Is Your Favorite?
In this lesson, 2nd graders will understand that tables help us organize information clearly.
Alabama Learning Exchange
Alex: Ice Cream Sundae Survey
Students quickly realize the importance of learning how to read and find information in charts, graphs, and tables compared to finding the same information written in a paragraph. This is a fun, high energy lesson!This lesson plan was...
E-learning for Kids
E Learning for Kids: Math: Tea Store: Reading a Table
Students will demonstrate how to interpret information in a table.
US Department of Labor
Bureau of Labor Statistics:labor Force Statistics From Current Population Survey
The Current Population Survey (CPS) is a monthly survey of households conducted by the Bureau of Census for the Bureau of Labor Statistics. It provides a comprehensive body of data on the labor force, employment, unemployment, and...
US Census Bureau
United States Census Bureau: Population Projections Tables
Series of projections for different years.
Alabama Learning Exchange
Alex: Great Golly Graphs
This lesson plan asks middle schoolers to create a survey project including graphs, questions, tables, and data analysis. It gives an assessment and ideas for remediation and extension as well as ways to manage behavior problems and...


