Curated OER
Surname Survey
Students use data from the U.S. Census Bureau to determine whether last names in a local phone directory reflect the Census Bureau's list of the most common surnames in the country. In this surnames lesson plan, students use the Internet...
Curated OER
Remembering Our Veterans
Eighth graders research a variety of military statistics while using the theme of Remebering Our Veterans. They use data management to plan and create a PowerPoint presentation with their findings. They incorporate different types of...
Curated OER
Local Traffic Survey
Students conduct a traffic survey and interpret their data and use graphs and charts to display their results.
Curated OER
Survey Says...
Students practice taking surveys to answer different questions about radio. In this communications lesson, students brainstorm to create questions they can ask strangers about how often they listen to their radio. Students...
Curated OER
The Gathering and Analysis of Data
Young mathematicians gather data on a topic, graph it in various forms, interpret the information, and write a summary of the data. They present their data and graphs to the class.
Curated OER
Canada Recycles! Do You?: Grades 4-6
In this recycling education worksheet, students read a table regarding Canadian recycling statistics and respond to 9 questions regarding the data.
Curated OER
A Thanksgiving Survey
Students take a survey then use the information gained from the survey to help plan a typical Thanksgiving dinner for our last day of class. They create a graph which corresponds the the data gathered during interviews.
Curated OER
The Household Environment Survey
Students examine data collected from a national survey of household environmental practices to develop their own questionaires. Once they have their own survey questions, students conduct their own investigations, and report their findings.
Curated OER
Inventors Unit Survey
Students develop and conduct a survey for their inventors unit. They create a five question survey and tally the survey results, and create a graph using Microsoft Word and Graph Club 2.0.
Curated OER
Whose Breakfast isn't for the Birds?
Students explore coffee production. In this cross-curriculum rainforest ecology lesson, students research regions where coffee comes from and investigate how the native birds in the rainforest are effected by coffee...
Curated OER
Conducting A Survey
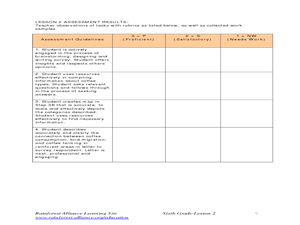
Students identify the types of information gathering styles and different surveying styles. They distribute a survey around your school to determine the different forms of transportation used to get to school.
University of Kansas
Newspaper in the Classroom
Newspapers aren't only for reading—they're for learning skills, too! A journalism unit provides three lessons each for primary, intermediate, and secondary grades. Lessons include objectives, materials, vocabulary, and procedure, and...
Curated OER
The Fact Finders
Students analyze agricultural data and make predictions about events in history. In this history lesson, students correlate the relationship between historic events and issues in agriculture to see if there is a correlation. They analyze...
Curated OER
Comparing the Health and Lifestyles of 13 Year-olds Around the World.
Eighth graders examine international data and statistics to evaluate the health and trends of 13 year old students around the world.
Curated OER
What on Earth is a Biome?
Students explore organisms and their environments. They examine change over time
demonstrate an understanding of physical positions on Earth. They survey earth's diversity, write a report, fill in a data table created on the...
Curated OER
Distribution of children living at home
Students use E-STAT to examine demographics. In this social demographics lesson, students use statistical data to determine if a particular family is in need of assistance. Students will discuss social and educational policies and...
Curated OER
Green Food Graph
Students explore graph making by investigating St. Patrick's day food. In this holiday food lesson, students discuss their favorite green foods in honor of St. Patrick's day. Students create a graph based on the data of which green foods...
Curated OER
Comparing the Food Choices and Body Image of 15-Year-Olds Around the World
Students interpret data regarding food choices and the perceived body image of youth in the world. For this personal health lesson, students compare food consumption patterns in Canada with other countries. Students also compare...
Curated OER
Undercounting Unemployment
Young scholars examine what defines unemployment numbers in the United States. In this economic data lesson, students complete worksheets, watch a video, and have a class debate in order to understand how the U.S. defines and comes up...
Curated OER
Rent and owner's major payments
Students retrieve and map census data to determine the average rent and owners' payments made throughout Canada. They find out how many people are spending more than 30 percent of their income on housing.
Curated OER
Favorite Christmas Carols
Third graders take a survey of friends' and family members' favorite Christmas carols. They illustrate a favorite Christmas carol and have students try to guess the name of the carol based on the picture.
Curated OER
Mapping the changes in Canada's population
Students find and analyze data found in the census. They compare the population from 1996 to 2001. They explore the type of data they can find in the Census of Population.
Curated OER
And the Winner Is...
Third graders participate in an election project. They collect data to create a spreadsheet from which a graph is generated.
Curated OER
Distribution of children living at home
High schoolers examine census data to evaluate the number of students of certain ages living at home. This data is then used to determine the need for day care, or other social programs. They use this information to explore social policies.


