Curated OER
Drip, Drip, Drip
Learners gather scientific data and be able to utilize the data to generalize results over a long period of time. They use the appropriate tools to measure quanities of liquids and analyze the data to determine the cost of a leaky faucet.
Curated OER
Ohio Census 1990 and 2000
Students begin the lesson plan by examining Census data from the state of Ohio from 1990 and 2000. Using a worksheet, they solve problems using the data and a calculator. They share their responses with the class and discuss what the...
Curated OER
Budgeting 101
Students identify various sources of income and discern between needs and wants as they also learn to create a personal budget. In this personal budget lesson, student understand financial scenarios as they relate to different ways...
Curated OER
Reading to Calculate
Young scholars explore uses of the calculator. They explore using reading strategies to solve problems. Students recognize when calculators are useful. They construct real life situations for calculator use.
Curated OER
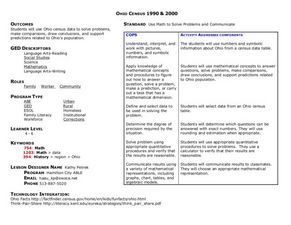
Ohio Census 1990 & 2000
Students use Ohio census data to solve problems, make comparisons, draw conclusions, and support predictions related to Ohio's population. They interpret and work with pictures, numbers and symbolic information.
Curated OER
EUREKA! Living Room Redecoration
Tenth graders calculate area and perimeter based on the dimensions of a living room. They use these calculations to respond to questions about supplies needed for painting and carpeting the room. Students use math to solve problems and...
Curated OER
Mathematical Magazines
Students use ads from magazines to create data to be measured and apply the skill of estimation. They record the percentage of magazine ads that could be separated into different categories made by students through the use of logical...
Curated OER
Not Everything Is More Expensive
Students investigate the concept of using different types of presentations to help solve mathematical problems. They research the use of illustrations to help understand data and its interpretation in a graphing format. Students also...
Curated OER
Ocean Life: A Heavy Subject
Second graders examine The Learning Page Fact Files about ocean life and categorize the data by weight and group. They distinguish between fish, mammals, and invertebrates and which weigh the most and the least. Students record their...
Curated OER
American Journeys: Right Place, Right Time
Sixth graders measure distances on a map using string and a ruler. They complete mathematical word problems about measurement.
Curated OER
School Yard Waste
Fourth graders examine the types of garbage that they collect on the playground. They collect the information in a spreadsheet and create a graph that displays the number of types of trash found. They design and monitor a playground...
Curated OER
Sweet Data
Students input data about the colors of their serving of M&M candies onto a spreadsheet. They create charts and graphs based on this information.
Curated OER
The Hot Dog Stand - An Annual Report
Middle schoolers run a computer simulation and collect data as they work and use the data to create an annual report for their business. It is desirable for students to do this project individually, but it could be done as a class using...
Curated OER
Backwards Writing: Reflections and Symmetry
Why is "ambulance" written backwards on emergency vehicles? Young geometers apply principles of symmetry to translate words written backwards. See if your school or district subscribes to Jobland, where you can view a clip that explains...
Curated OER
Exponential Models
Students fit a continuous change exponential model to U.S. population data and use the model to predict future population.
Curated OER
The Case of the Biological Biosphere: Health, Math, Technology
Students investigate various aspects of the human body in this imaginative Tree House Detective episode about the biological biosphere. In a series of They take measurements, analyze data, and use technology. The lessons revolve around...
Curated OER
What Color Are Your Skittles?
Students create spreadsheets and manipulate data. They collect data, create appropriate graphs and use percentages to describe quantities. Students compare and contrast data. They use spreadsheets to generate a pie chart.
Curated OER
Excel temperature Graphs
Learners gather data about the weather in Nome, Alaska. In this Nome Temperature lesson, students create an excel graph to explore the weather trends in Nome. Learners will find the average weather and add a trend line to their graph.
Curated OER
Timelines
Students examine evolutionary history; the earth's timeline by creating timelines. They determine the timeframes of era, epochs, and periods and study the species that were evident in each.
Curated OER
Fruit Loop Graphing
Fifth graders interpret data and create graphs. Given Fruit Loops, they sort and classify according to color. Using spreadsheet technology, 5th graders record their data and create bar and circle graphs. Students analyze data and...
Curated OER
Which Method Will You Choose? Finding Solutions to Systems of Equations.
Ninth graders investigate systems of linear equations. In this Algebra I instructional activity, 9th graders determine which method is the best for solving a systems: graphing, substitution, or elimination. Students choose a method...
Curated OER
Sorting Quadrilaterals
Tenth graders investigate the geometric concept of quadrilaterals. They are given a set of shapes and asked to sort the quadrilaterals from the others. Then working in pairs they discuss the characteristics and write down the description...
Curated OER
Questionnaires and Analysis
Students, review the techniques and different types of data analysis as well as how they are expressed, identify why facts and data are needed in conclusion of a questionnaire. The concepts of qualitative and quantitative data are...


