Curated OER
Population Density In Fish
Middle schoolers investigate how a population of fish multiplies in an ecosystem and the kinds of things that must be done to maintain a healthy population balance with other organisms that live there. They conduct an experiment to test...
Curated OER
Population Density
Pupils use the scientific method to conduct an experiment and use varied methods to gather background information. They correctly use lab equipment and prepare tables and graphs that organize, conclude, and present their findings. ...
Curated OER
Comparison of Snow Cover on Different Continents
Students use the Live Access Server (LAS) to form maps and a numerical text file of snow cover for each continent on a particular date. They analyze the data for each map and corresponding text file to determine an estimate of snow cover...
Curated OER
Aruba Cloud Cover Measured by Satellite
Students analyze cloud cover and to compose written conclusions to a given related scenario. They submit a letter of response and a report detailing their calculations and conclusions.
Curated OER
Collecting And Fitting Quadratic Data
Students investigate the concept of using quadratic data to plot coordinates on a plane. They also apply the quadratic formula for a variety of problems with the help of a graphing calculator to draw the parabola for given coordinates.
Curated OER
Applications Of Rational Functions
Young scholars engage in a lesson that is about relational functions with the application of methods to real life problem situations. They use the examples found in the lesson for the purpose of practice during guided instruction....
Curated OER
More Complicated Functions: Introduction to Linear Functions
Learners explore the concept of linear functions. In this linear functions activity, students translate linear functions from tables to graphs to equations. Learners use an applet to write a function rule for a linear function in...
Curated OER
More Students Taking Online Courses
In this graph learning exercise, students study a bar graph that shows the number of college students taking at least one online course. Students answer 4 problem solving questions about the data on the graph.
Curated OER
Guess the Age
Students explore functions using real world application. In this algebra activity, students play a game as they apply concepts of function. They graph their findings and discuss it with the class.
Curated OER
The football and Braking Distance; Model Data with Quadratic Functions
Students use the quadratic formula to solve application problems. The first problem relates to the path of a football thrown from the top of the bleachers. Students compute the time it will take the football to reach certain heights. In...
Curated OER
Lesson 3: Understanding Population Growth
Students explain population growth in Maryland and its relationship with age structure, household growth and consumption of land.
Curated OER
Antibiotic Resistance in E. coli
Students discuss the antibiotic resistance of bacteria. They design an experiment to test the resistance of different strands of E. coli. They answer discussion questions to end the lesson plan.
Curated OER
Graphing Your Motion-Day 1
Ninth graders explore the concepts of motion, velocity and acceleration through graphing their own movement using LoggerPro. They become more familiar with the computer technology. Students explore graphing in real time and graph on...
Curated OER
Snow Cover By Latitude
Pupils examine computerized data maps in order to create graphs of the amount of snowfall found at certain latitudes by date. Then they compare the graphs and the data they represent. Students present an analysis of the graphs.
Curated OER
Introduction To Data Analysis
Seventh graders investigate the concept of looking at the data put in a variety of ways that could include graphs or data sets. They analyze data critically in order to formulate some sound conclusions based on real data. Students graph...
Curated OER
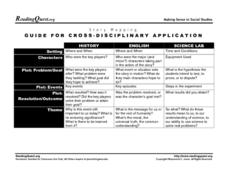
Story Mapping: Guide for Cross-Disciplinary Application
In this story mapping worksheet, students read how story mapping can apply to 3 different areas of study: history, English and science lab. The components of story mapping that are included here are setting, characters, problem/goal,...


