Nuffield Foundation
Investigating Factors Affecting the Heart Rate of Daphnia
What variables change heart rate? Young scientists observe the beating heart in Daphnia to understand these variables. They make changes in temperature, chemicals, and other factors as they graph the heart rates. Analysis questions help...
5280 Math
Go with the Flow
Round and round they go ... where they stop, only scholars will know. By writing systems of equations, classes determine the number of cars a roundabout can handle given specific constraints. Systems use up to six variables and become...
Curated OER
Lesson 2-5: Absolute Value Functions and Graphs
What is absolute value? What is an absolute value function? Emerging mathematicians solve equations containing variables inside an absolute value sign. They graph each function on a coordinate plane and identify the maximum and minimum...
Curated OER
Starch
Students examine the basics of starch and how it is used in food. In this photosynthesis lesson students experiment with variables that affect starch production in photosynthesis.
Science Geek
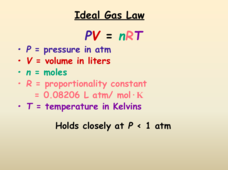
The Ideal Gas Law
When doing a gas lab, you might feel under pressure. A short presentation discusses the Ideal Gas Law. It begins with the units for each variable, then describes the behavior of real gases. The lesson concludes with a comparison of...
Teach Engineering
The Fibonacci Sequence and Robots
What better way to introduce the idea of a sequence than with robots! An educational instructional activity explains the classic Fibonacci sequence before pupils build and program a robot to move. Additionally, the instructional activity...
Teach Engineering
Pointing at Maximum Power for PV
Following detailed directions, teams collect the voltage and current outputs of a photovoltaic cell by adjusting the resistance. Using the collected data, they determine the highest power output. Implications for weather and a large...
Curated OER
How does the solution change?
Four simple equations, each with two variables, try to get at the important question of reasoning about equations. The problem isn't to solve the equations, but to understand the nature of their solutions. These equations address the...
Curated OER
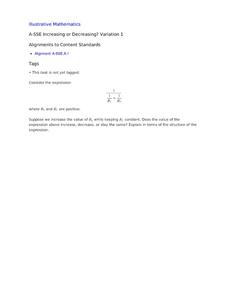
Increasing or Decreasing? Variation 1
Your algebra learners analyze the value of an algebraic expression to decide if it will increase, decrease, or stay the same when one variable is changed as the others stay constant. Their collaborative efforts culminate with a written...
Illustrative Mathematics
Tilt of Earth's Axis and the Four Seasons
Geometry meets earth science as high schoolers investigate the cause and features of the four seasons. The effects of Earth's axis tilt features prominently, along with both the rotation of the earth about the axis and its orbit about...
Willow Tree
Surface Area of Three-Dimensional Figures
Lateral area and surface area are simple concepts, but calculating them is not as easy! Using formulas, learners calculate lateral area and surface area for the same three-dimensional figures. The resource discusses the formula variables...
Shodor Education Foundation
Linear Inequalities
An interactive lesson helps individuals learn to graph inequalities in two variables. Scholars can adjust the interactive to present the inequalities in standard or slope-intercept form.
Shodor Education Foundation
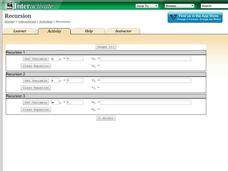
Recursion
Perform the operation ... and then do it again. Scholars investigate recursive formulas by creating and graphing them. Using the interactive, pupils set the variable, determine the initial value, and type in a recursive formula.The...
Mascil Project
Epidemics: Modelling with Mathematics
The Black Death epidemic is responsible for more than one million deaths in the United Kingdom. An inquiry-based activity has young scholars explore the rate of disease spread. They then analyze graphs showing data from epidemics such as...
Curated OER
Factors That Affect Climate
Fifth graders use captured portions of the Internet ("mininets") to perform research into climate. They create graphs of the data recorded using latitude as the independent variable and temperature as the dependent variable.
Utah Education Network (UEN)
Linear Relationships: Tables, Equations, and Graphs
Pupils explore the concept of linear relationships. They discuss real-world examples of independent and dependent relationships. In addition, they use tables, graphs, and equations to represent linear relationships. They also use ordered...
Curated OER
pH Testing
Students explore the use of variables in the scientific method. They identify the dependent and independent variables through pH testing. Students construct graphs of their data and analyze their findings.
Curated OER
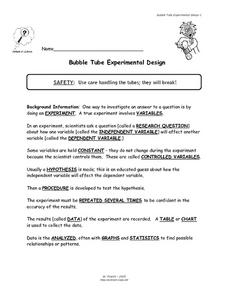
Bubble Tube Experimental Design
Learners study what an experiment is comprised of and how to be successful when doing an experiment. In this experimental lesson plan students design their own experimental investigation and answer questions.
Curated OER
Evaporation Marathon
Students review the steps of the scientific method and participate in a three day experiment. They observe water evaporation over time.
Curated OER
Carbon Monoxide and Population Density
Tenth graders investigate the carbon monoxide level at a fixed latitude to determine if there is a relationship to population density. They download data sets and generate a graph, and find locations using the Earth's coordinate system....
Rochester Institue of Technology
Meal Picking
Scholars explore systems design and its relation to meal picking by using computer simulations to test systems designs. They learn about the Pick-to-Light System and calculate average picking times.
Curated OER
Fast Talker - Ch 2 project
Tongue Twisters?! Create scatter plot graphs based on timing fellow classmates saying tongue twisters. Then investigate, display, and analyze the relationships based on functions. Wrap up this activity by making a poster or other...
Khan Academy
Challenge: Mickey Mouse Ears
My, what big ears you have! Novice JavaScript programmers adjust Mickey's ears to be proportional with his face and any changes to it. The key is to use variable expressions so that the values used are dependent upon the variable that...
Illustrative Mathematics
Operations on the Number Line
A different way to look at integers is on this number line with variables in place of numbers. Learners are to look at different expressions and describe why they think the answer would be positive or negative, depending on the location...
Other popular searches
- Identify Dependent Variable
- Dependent Variable Worksheet
- Independent Dependent Variable
- Dependent Variable Math
- Dependent Variable, Math


