Illustrative Mathematics
Tilt of Earth's Axis and the Four Seasons
Geometry meets earth science as high schoolers investigate the cause and features of the four seasons. The effects of Earth's axis tilt features prominently, along with both the rotation of the earth about the axis and its orbit...
Curated OER
The Class Trip
Mrs. Moore's class is trying to earn money for a trip to the science museum, but how much more do they need? Solve this problem with your own class as they develop their ability to model real-life situations algebraically. As an added...
Illustrative Mathematics
Chocolate Bar Sales
In this real-world example, algebra learners start to get a sense of how to represent the relationship between two variables in different ways. They start by looking at a partial table of values that define a linear relationship. They...
Howard County Schools
Setting the Table
How many people can fit around a table? Depends on the size of the table, right? Explore patterns to generate an equation for the number of people that can fit around a table given its size.
5280 Math
Go with the Flow
Round and round they go ... where they stop, only scholars will know. By writing systems of equations, classes determine the number of cars a roundabout can handle given specific constraints. Systems use up to six variables and become...
Curated OER
How does the solution change?
Four simple equations, each with two variables, try to get at the important question of reasoning about equations. The problem isn't to solve the equations, but to understand the nature of their solutions. These equations address the...
Curated OER
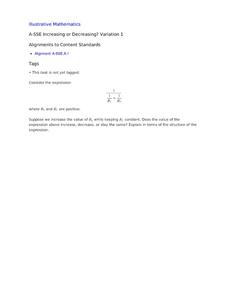
Increasing or Decreasing? Variation 1
Your algebra learners analyze the value of an algebraic expression to decide if it will increase, decrease, or stay the same when one variable is changed as the others stay constant. Their collaborative efforts culminate with a written...
Illustrative Mathematics
Operations on the Number Line
A different way to look at integers is on this number line with variables in place of numbers. Learners are to look at different expressions and describe why they think the answer would be positive or negative, depending on the location...
Illustrative Mathematics
Firefighter Allocation
Creating equations with one variable to solve real-world-type problems is a key skill any algebra learner needs to master. Here the focus is on realizing that one can write the equation in different ways depending upon how one...
Curated OER
Flipping for a Grade
What happens when your teachers get tired of grading tests and want to use games of chance to determine your grade? How would you decide which game they should play? Learn how to use expected value and standard notation to compare two...
Illustrative Mathematics
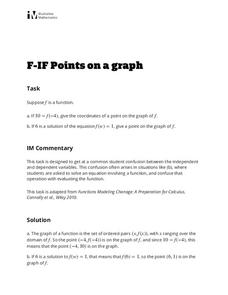
Points on a Graph
Learners practice using their knowledge of how to interpret a function and use function notation. The activity includes two questions. Given an input of a function and its output, the first question asks learners to write the ordered...
Curated OER
Music and Sports
With so much talent in the classroom, do your musicians and athletes have related interests? This problem has your learners taking data from their classmates to decide whether there is an association between the two activities. The...
Illustrative Mathematics
How Many Buttons?
Bring the class into the probability by having everyone count buttons on their shirts. Organize the data into the chart provided and chose different possibilities such as "female with one button" or "all learners with more than four...
Illustrative Mathematics
Telling a Story With Graphs
Turn your algebra learners into meteorologists. Learners are given three graphs that contain information about the weather in Santa Rosa, California during the month of February, 2012. Graph one shows temperatures, graph two displays the...
Illustrative Mathematics
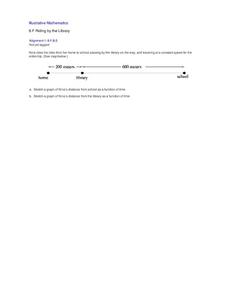
Riding by the Library
Draw a graph that shows the qualitative features of a function that has been described verbally. Make sure learners understand where time is zero and the distance is zero. It may take them some time to understand this concept, so working...
Illustrative Mathematics
Running at a Constant Speed
The learner must use the given constant speed to find the unit rate. A table is made in order to relate the speed to the time and the distance. From the table, learners are able to see the unit rate in miles per minute and miles per...
Illustrative Mathematics
Egyptian Fractions II
The Egyptians used unit fractions to describe all other fractions. Your class will rewrite rational expressions in order to deduce information about rational numbers. The activity starts with specific fractions, guides you through a few...
Illustrative Mathematics
High School Graduation
An exercise in finding the approximate time that a name would be called at a graduation. Estimating time may be difficult for some of the class, so this resource would not be a good choice for learning this standard. It does end with a...
Teach Engineering
Windy Tunnel
Lift—it is about the wing's attack. Using a virtual wind tunnel, pupils investigate wing shape and angle of attack. Learners use worksheets to record their observations and to convert verbal relationships into mathematical equations in...
Teach Engineering
Club Function
Let's get the herd to follow the rules. The activity associated with the second lesson in the unit introduces the class to the definition of a function. Individuals must gather in groups of zebras and rhinos defined by the general...
Texas Instruments
Texas Instruments: Math Today for Ti Navigator System Cropland Value Grows
Students will create a scatter plot for the data in the USA TODAY Snapshot, "Cropland value grows," and identify the independent and dependent variables for the data. The students will find the rate of change for the data and label this...
Texas Instruments
Texas Instruments: Math Today More Students Apply Early
In this activity students will explore scatterplots and independent and dependent variables. Students will find the mean value of the number of students applying under the early decision plan.
Texas Instruments
Texas Instruments: Math Today for Ti Navigator System: More Students Apply Early
Using the USA TODAY Infograph, "More students apply early," students will explore scatter plots and independent and dependent variables. Students will determine a best-fit regression model for the real-life data set and then use the...
Texas Instruments
Texas Instruments: Domain and Range
This StudyCard stack uses real-world contexts to teach the concepts of independent and dependent variables, and then domain and range. It includes practical examples at the end.


