Curated OER
Ice Creams
Pupils list all the outcomes for single events, and for two successive events in a systematic way. When dealing with a combination of two experiments, they identify all the outcomes, using diagrammatic, tabular or other forms of...
Curated OER
Satellite Tracker
Middle schoolers use satellite tracking software to monitor different satellites. They predict and graph the motion of the space station. They create a 3-D display of its path and share it with the class.
Curated OER
What was Newton's Idea of Science?
Students form logical foundations for analysis of observations. They improve analytic reading abilities through practice. Students investigate the foundations of scientific thought processes and how to apply them.
Curated OER
How Many? How Far? How Thick?
Fifth graders examine the role of magnetism and electricity. In groups, they are given different types of magnets and discover how the magnetic force differs for each one. They measure the amount of distance a paper clip moves toward...
Curated OER
This Stuff Makes Me Sick
Students participate in a lab showing the effects of pesticides on Lumbriculus variegatus. Several extensions and variations are also included in this lesson including one which relates the experiment to how pesticides enter our drinking...
Curated OER
Classroom Science Fair Project
Students explore the skills and information needed to complete a science fair project. They follow guidelines to create an document their science fair project.
Curated OER
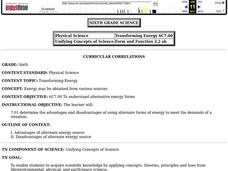
Transforming Energy
Sixth graders study about alternate energy sources and discuss with their neighbor how alternative energy sources affect environmental conditions so that an entire species could be affected.
Curated OER
Wind Distribution of Weed Seeds
Students investigate how many seasons it would take for wind to disperse seeds one mile downwind from an initial growth of one spotted knapweed plant. They construct and use a wind tunnel as part of their experiment and graph their results.
Curated OER
Chaos and Fractal Applications
Eighth graders identify the different applications of fractals. In this math lesson, 8th graders use graphing calculator to solve algorithms. They explain how changing parameters and initial conditions affect the solutions.
Curated OER
Hazard Mitigation: Bioterrorism
Students discuss different ways to spread infectious diseases. In this bioterrorism lesson, students model the rate of smoke emission using CalRoad software. They analyze the effects of airborne release of biological...
Curated OER
Lift Equation Problem Set
Students, after reading an explanation from a NASA Web-based textbook, demonstrate an understanding of the text by using it, along with FoilSim, to complete an activity to graph and interpret the lift equation.
Illustrative Mathematics
Illustrative Mathematics: F if Points on a Graph
This task will help students understand the difference between between independent and dependent variables. Aligns with F-IF.A.1.
Science Buddies
Science Buddies: Scientific Method Variables/hypothesis
Find out what variables are in a scientific investigation and what the difference is between an independent, dependent, and controlled variable. Look at samples of different types of variables and find out what makes a good variable.
Shodor Education Foundation
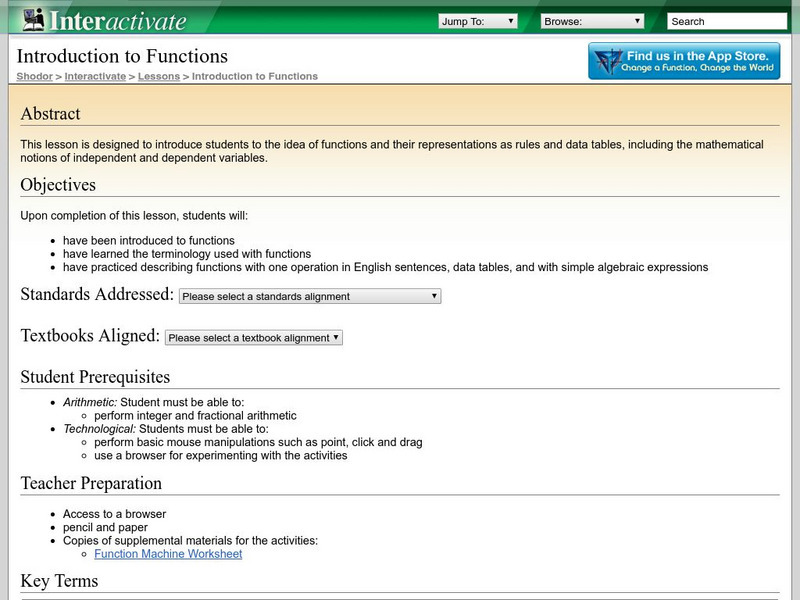
Shodor Interactivate: Lesson: Introduction to Functions
Input numbers into the function machine and explore independent and dependent variables.
Shodor Education Foundation
Shodor Interactivate: Lessons: Advanced Fire
Lesson plan to help students understand independent and dependent variables through a fire probability simulation.
Science Education Resource Center at Carleton College
Serc: Investigating Motion: Calculating and Graphing Students Walking Speed
In this activity students will collect and analyze data of their walking speed. They will compare their speed to an outside speed walker. They will determine their speed every 20 meters up to 100 meters. They will complete five trials to...
Illustrative Mathematics
Illustrative Mathematics: 8.f Riding by the Library
In this task, 8th graders draw the graphs of two functions from verbal descriptions. Both functions describe the same situation but changing the viewpoint of the observer changes where the function has output value zero. This forces the...
Alabama Learning Exchange
Alex: The Pattern of Graphing Linear Equations
The middle schoolers will extend the knowledge of algebraic expressions from geometric representations and ultimately graph linear equations with understanding. The students will also develop a better understanding of algebraic...
BSCS Science Learning
Bscs: Asking and Answering Questions With Data
This inquiry is intended to provide students with practice developing investigable questions that need data, and specifically large datasets, to be answered. Click the teacher resources link for teaching guides and student handouts.
Science Education Resource Center at Carleton College
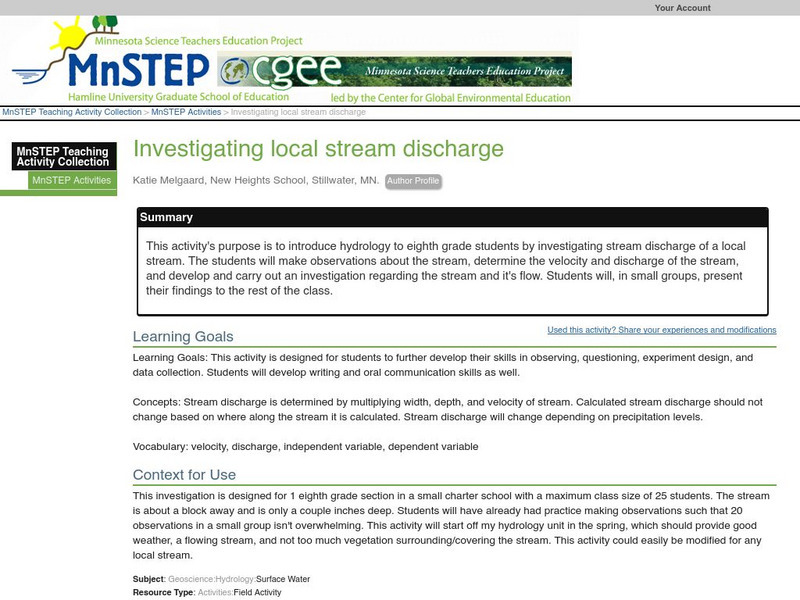
Serc: Investigating Local Stream Discharge
This activity's purpose is to introduce hydrology to eighth grade students by investigating stream discharge of a local stream. The students will make observations about the stream, determine the velocity and discharge of the stream, and...
Shodor Education Foundation
Shodor Interactivate: Lesson: More Complicated Functions: Intro Linear Functions
In this lesson, young scholars learn about linear functions and how they can be represented as rules and data tables. Includes a worksheet with exploration questions to accompany an interactive Linear Function Machine. The lesson plan is...
Other
Nearpod: Distance Time Graphs
In this lesson on distance-time graphs, students will understand graphing by analyzing distance-time graphs.
Science Education Resource Center at Carleton College
Serc: Flow Characteristics of the Crow River
Students make observations of a local river, and then formulate a question. Then, through guided inquiry, construct, conduct, and collect data on a question they wish to research. Students keep a field journal of their observations,...


