Curated OER
Climate Patterns across the United States
Students articulate differences between climate and weather using examples in a written statement. Using climate data from across the country, they describe climate patterns for various parts of the United States on a map. Students...
Curated OER
The Great Tin Race
Students construct and race tin can cars. In this motion lesson plan, groups build tin racers, complete timed runs, and record their data on the provided worksheet. The teacher leads a discussion comparing data between groups. Specific...
Curated OER
Comparison of Two Different Gender Sports Teams - Part 3 of 3 Scatter Plots and Lines of Best Fit
Students create a scatter plot for bivariate data and find the trend line to describe the correlation for the sports teams. In this scatter plot lesson, students analyze data, make predictions,and use observations about sports data...
Physics Classroom
Action at a Distance Lab
The concepts involved with static electricity are typically taught in upper elementary physical science units. The lab described in this resource has pupils examine the behavior of small pieces of paper and a balloon when a charged piece...
Curated OER
Batteries in Series
Eighth graders examine batteries in a series circuit and the associated voltage. They determine, through inquiry and problem solving, that the total voltage of batteries in a series is the sum of the voltage of each battery. They design...
Curated OER
Clouds and the Weather
Fourth graders analyze the relationship of clouds and local weather. Students also observe and record cloud data and weather conditions daily as they research different cloud types. The data is analyzed looking for trends in daily...
Curated OER
Choosing the Best Graph
Eighth graders produce and examine two sets of data and create what they believe to be the most appropriate graphs to represent these sets of data. After completing the pre-assessment, they discuss reasons for using each type of graph...
Curated OER
Party, Party, Party
Second graders conduct investigations with counting, comparing, organizing, analyzing, displaying and interpreting data. They pose questions for investigation and collect the data. Students display the data in tally charts, uniform...
Curated OER
Line of Best Fit
Students identify the line of best fit. In this statistics lesson, students collect and analyze data. They calculate the regression equations and identify the different types of correlation.
Curated OER
Climate Characteristics of Canadian Localities
Tenth graders match the climate data to a Canadian city. They justify their choice, referring to factors that affect climate. They use the Atlas of Canada's Advanced Search to locate specific communities.
Curated OER
Hot, Wet, and Cold
Learners research climate data for a city in each of the 5 major geographic sections of Texas. They use data to describe the climate and what influence the geography of that section has on the weather.
Curated OER
Satellite Tracking
Young scholars apply satellite tagging data to investigate questions related to open-ocean animals, their habitats, and their migratory behaviors. They determine how physical or biological factors determine organism behavior using a data...
Curated OER
Harry Potter Research Project
Students work together to complete a research project on Harry Potter. They write a research question and develop a survey to give to their classmates. Using the results, they create a graph and draw conclusions about the data collected.
Curated OER
Grab Bag Experiment
Students analyze and record data. In this lesson about graphing and gathering data, students learn about the step of an experiment. Students learn new vocabulary, sort beans, record the data, and graph the data. Students add a variable...
Curated OER
Watts Up Doc?
Young scholars examine the wattage of a light bulb using math. In this algebra lesson, students find the inverse square of given parameter. They work in groups collecting and analyzing data.
Curated OER
Cold Enough?
Young scholars read and record temperatures and display the data. They represent the temperatures on an appropriate graph and explain completely what was done and why it was done. Students display the data showing differences in the...
Curated OER
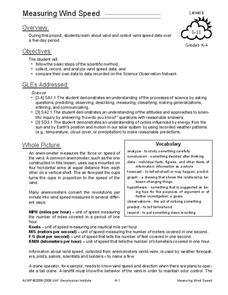
Measuring Wind Speed
Students study wind speed and collect wind speed data. In this wind speed instructional activity, students visit a website to learn about the local wind speed forecast for their week. Students discuss wind and wind speed. Students...
Curated OER
Cancer: A Crisis of the Cells
Students analyze cancer data represented in graphs and charts. They describe the changes in cell structure and function as the result of cancer. They also examine phenomenas that are believed to cause cancer.
Curated OER
Mean, Median, Mode, and Range: Reteach
In this line plots worksheet, students review how to make a line plot to show data and review the steps to find mean, median, mode, and range. Students then make a line plot for the data in exercise 1 and use it to answer the remaining...
Curated OER
Amusement Park Physics
Students get up close and personal with principles of motion. For this physics lesson, students collect and analyze acceleration data on amusement park rides. Students use CBLs to collect data in this lesson.
Curated OER
Campaign 2000
Learners research newspapers and the Internet to learn about the election. Students work in groups and choose a state that they want to compare to Florida. Learners organize the data they have found into a graph labeling an "x" and "y"...
Curated OER
Normal Probability Plot
Young scholars analyze the graph of a distribution. In this statistics lesson, students define skewed or mound shape distribution as they investigate the data behind the graph. They define and plot outlier as well as normal probability.
Virginia Department of Education
Thermochemistry: Heat and Chemical Changes
What makes particles attract? Here, learners engage in multiple activities that fully describe colligative properties and allow the ability to critically assess the importance of these properties in daily life. Young chemists conduct...
Curated OER
Exercise Those Statistics!
Students participate in various activities, measuring their pulse rates and recording the data. They analyze the statistical concepts of mean, median, mode, and histograms using the data from the cardiovascular activities.


