Curated OER
Interpreting and Displaying Sets of Data
Students explore the concept of interpreting data. In this interpreting data lesson, students make a line plot of themselves according to the number of cubes they can hold in their hand. Students create their own data to graph and...
Curated OER
Impossible Graphs
Young scholars practice plotting functions on the Cartesian coordinate plane while participating in a discussion about the Possible Or Not worksheet/activity. Students also use the Impossible Graphs worksheet to practice reading a graph,...
Curated OER
Geometry: Parallel and Perpendicular Lines
This basic handout would be good for skills practice or a review of parallel and perpendicular lines. Review the definitions, then practice writing equations of lines that pass through a specific point and are either parallel or...
Curated OER
How Alike Are We?
Fourth graders find the range, mode, median, and mean for each of the data sets (height and shoe size). They discuss which measure of central tendency for each data set best represents the class and why. Students graph the shoe size and...
Curated OER
A Special Relationship
Students discover the relationships of the lengths of the sides of right triangles and right triangles using a series of drawings on dot paper. They investigate and solve problems of standard (customary and metric units) and non-standard...
Curated OER
Transformations and Exponential Functions
Tenth graders study graphing exponential functions. For this transformations lesson, 10th graders apply inquiry to determine how changes to a parent function affect its graph. Students analyze transformed graphs and generate the function...
Curated OER
Calculator-Based Lessons Help Examine Real-World Data
Students may determine equations based on graphs and regression models.
Curated OER
Counting Pills
Students are introduced to the problem. They brainstorm ideas for approaching the problem and keeping track of what has been done. Students work on the problem in pairs to discover what strategies might help to find the answer.
Curated OER
The Topsy-Turvy Twins
Fourth graders read the problem and brainstorm for ways to solve the problem - list these on the board for the students to refer to as they solve the problem. They work in pairs and focus on the strategy selected.
Curated OER
QwikQure Algebra
Fourth graders are introduced to the problem using a bottle of medicine. They estimate the volume of the medicine and predict the instructions on the bottle. They then think about how they might solve the problem before asking them to...
Curated OER
You Can Count on Squares!
Fourth graders engage in and explore to develop mathematical, specifically algebraic, ideas. Although the tasks are built around measurement, they are algebraic to the extent that they require 'formulae' to be derived form the geometric...
Curated OER
The Farmer's Sheep II
Fourth graders listen to the story of a farmer who only likes to be able to see nine sheet from his window. His wife has brought him another sheep - what now? They work together in pairs to solve the problem and share solutions.
Curated OER
Exploring Arrangements of 2, 3, 4, and 5 Cubes
Students use problem solving skills to create various models of tricubes, tetracubes, and pentacubes. They classify the cubes into various groupings and identify them as mirror images, regular arrangements, and irregular arrangements....
Curated OER
What's The Point?
Learners solve word problems using the correct math symbols. In this algebra lesson, students use the TI calculator to graph their equation and analyze it. They find the line of regression and use to draw conclusion.
Curated OER
Reading Graphs
Students plot functions on the Cartesian coordinate plane. They explore lines and parabolas. Students analyze graphs and answer questions about the information presented on the graph using an online program.
Curated OER
Cartesian Coordinate System
Students explore the Cartesian coordinate plane and plot points on the graph. They interpret coordinates for a point from the graph and give the ratio of rise over run for slope.
Curated OER
The Quadratic Formula
Students solve quadratic function by completing the square. In this algebra lesson plan, students use the quadratic formula to factor quadratics and find the roots. They graph the parabola and identify its properties.
Curated OER
My Peanut Butter is Better Than Yours!
Learners explore the concept of statistical data. In this statistical data instructional activity, students read an article about the dangers of peanut butter to those who are allergic. Learners perform a taste test of two different...
Alabama Learning Exchange
The State Capital of Stem and Leaf
Students explore the concept of stem and leaf plots. In this stem and leaf plots lesson, students plot the 50 US states' capitals on a stem and leaf plot according to the first letter of each state. Students compare their stem and leaf...
Curated OER
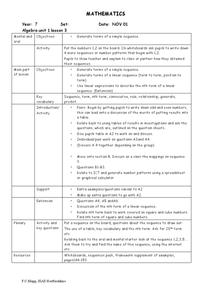
Simple Sequence
Students identify the nth term in a sequence. In this algebra lesson, students generate sequences given the formula for each sequence. They find the formula given the sequence.
Curated OER
Between The Extremes
Students analyze graphs for specific properties. In this algebra lesson, students solve equations and graph using the TI calculator. They find the different changes that occur in each graph,including maximum and minimum.
Curated OER
Investing
Learners collect data on investments and draw conclusions. In this algebra lesson, students analyze exponential graphs as they relate to money. They discuss the cause of an account balance being high or low.
Curated OER
Walking on Air
Students collect and analyze data with a graph. In this statistics lesson, students use central tendencies to find the meaning of their data. They display the data on a Ti calculator.
Curated OER
The Absolute Truth
Young scholars solve problems of inequalities and equations. In this algebra lesson, students add, subtract, multiply and divide to solve inequalities. They graph their solutions on a number line.


