Hi, what do you want to do?
Varsity Tutors
Varsity Tutors: Hotmath: Practice Problems: Correlation and Lines of Best Fit
Twenty problems present a variety of practice determining correlation based on data in a scatter plot and using lines of best fit with given data. They are given with each step to the solution cleverly revealed one at a time. You can...
Texas Instruments
Texas Instruments: Scatterplots and Correlation With Ti 89
Students input data relating the values of one variable associated with values of another and use these data to generate a scatterplot. From the scatterplot, they determine whether there is a correlation between the two variables and...
McGraw Hill
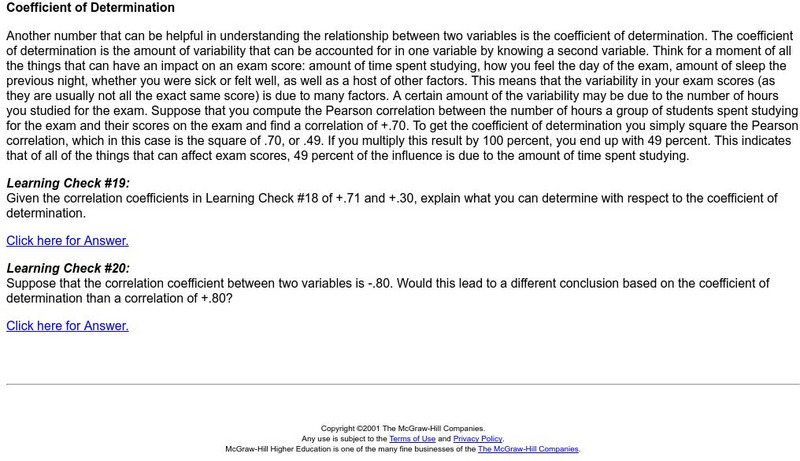
Mc Graw Hill : Coefficient of Determination
An explanation of the coefficient of determination from the social science perspective. Includes two practice problems and their solutions.
Sophia Learning
Sophia: Linear Correlation Tutorial
Use examples to determine and explain the linear correlation of independent and dependent variables.
Oswego City School District
Regents Exam Prep Center: Scatter Plots and Line of Best Fit
Use this lesson, practice exercise, and teacher resource in planning instruction on scatter plots and line of best fit. In the lessons, you'll find definitions and examples of ways to make a scatter plot, determine correlations, and find...
Texas Instruments
Texas Instruments: Da Vinci's Proportions
This activity is designed to help students work with linear regression models, error, correlation coefficients and coefficients of determination. In this activity students not only deal with the mathematical concepts of regression but...
CK-12 Foundation
Ck 12: Statistics: Linear Regression Equations
[Free Registration/Login may be required to access all resource tools.] Use a calculator to create a scatter plot and to determine the equation of the line of best fit.
Texas Education Agency
Texas Gateway: Interpreting Scatterplots
Given scatterplots that represent problem situations, the student will determine if the data has strong vs weak correlation as well as positive, negative, or no correlation.
Texas Education Agency
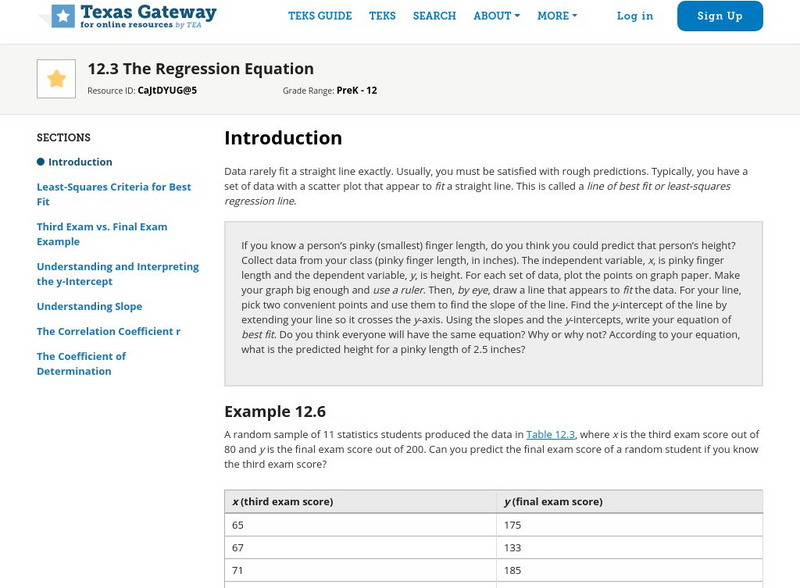
Texas Gateway: Tea Statistics: The Regression Equation
A tutorial on how to find the line of best fit or least-squares regression line for a set of data in a scatter plot using different methods and calculations.
Texas Instruments
Texas Instruments: Work vs. Leisure
Students can use lists of data and the correlation factor of various regressions to determine the best regression line.
Texas Instruments
Texas Instruments: Numb3 Rs: "Take Out" Outliers
Based off of the hit television show NUMB3RS, this lesson has students create box-and-whisker plots for given data, and then determine which (if any) data points are outliers. Students determine outliers through two methods in this...
Thinkport Education
Thinkport: Algebra Ii: Linear, Quadratic and Exponential Regression
Review linear regression and analyze how well this model fits the data. You will also be introduced to residuals and the correlation coefficient, and use these tools to determine whether or not a linear model is the best fit for a set of...
Georgia Department of Education
Ga Virtual Learning: Historical Geology
In this interactive tutorial you will explore how geologists use clues in rocks to determine the order in which rocks formed. Learn how principles of radioactivity are used to assign actual ages to rocks. Students will explore fossils...
Shodor Education Foundation
Shodor Interactivate: Regression
Plot a bivariate data set, determine the line of best fit for their data, and then check the accuracy of your line of best fit.
Other
Stat Soft: Statistics Glossary
Dozens of statistical terms are defined and illustrated in this glossary.
TeachEngineering
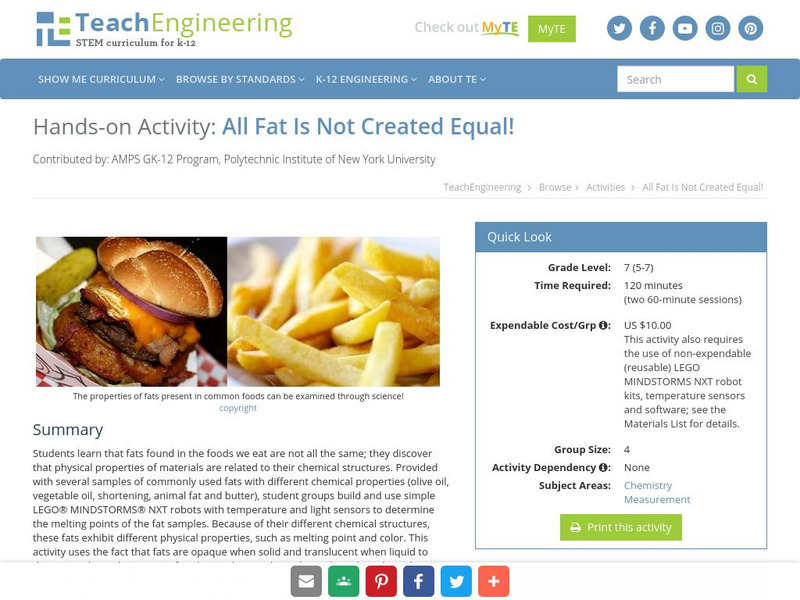
Teach Engineering: All Fat Is Not Created Equally!
Students learn that fats found in the foods we eat are not all the same; they discover that physical properties of materials are related to their chemical structures. Provided with several samples of commonly used fats with different...
Science Education Resource Center at Carleton College
Serc: Investigating Lava Flows and Their Imapct on Shoreline Features
In this field geology activity, learners will explore basaltic lava flows along the shoreline of Lake Superior, and begin to gain an understanding of the geologic story of Minnesota's North Shore. They will make observations about...
Texas Instruments
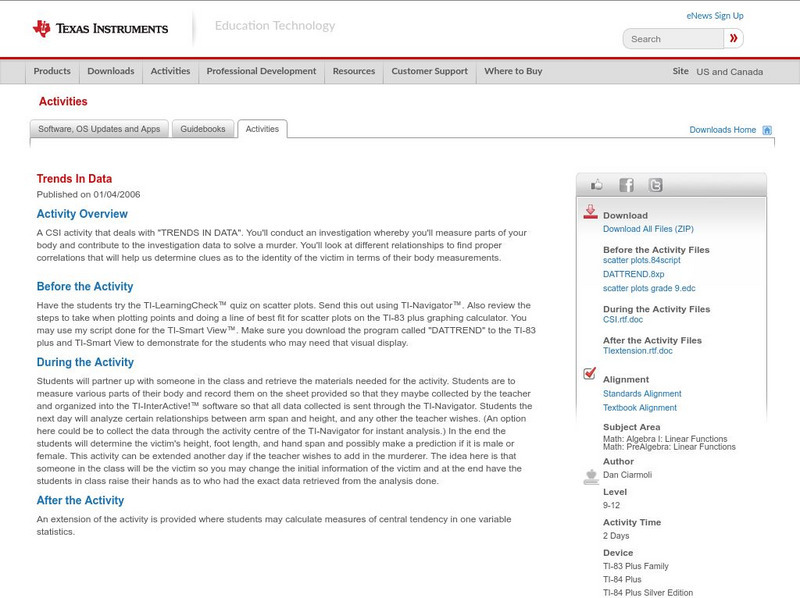
Texas Instruments: Trends in Data
A CSI activity that deals with "TRENDS IN DATA". You'll conduct an investigation whereby you'll measure parts of your body and contribute to the investigation data to solve a murder. You'll look at different relationships to find proper...
Texas Instruments
Texas Instruments: Height vs Arm Span
This is a quick class opener. That allow students to practice reading scatter plots and determining the correlation among data points.
Science Education Resource Center at Carleton College
Serc: Musical Plates: A Study of Earthquakes and Plate Tectonics
Four part lab activity involves students using real-time data to solve a problem, study the correlation between earthquakes and tectonic plates, and determine whether or not there is a relationship between volcanoes and plate boundaries.
Climate Literacy
Clean: Temperature and Precipitation as Limiting Factors in Ecosystems
Students correlate graphs of vegetation vigor with those of temperature and precipitation data for four diverse ecosystems, ranging from those near the equator to the poles, to determine which climatic factor is limiting growth.
Khan Academy
Khan Academy: Eyeballing the Line of Best Fit
Students practice informally graphing a line of best fit to a scatter plot and answer questions to determine if a scatter plot has a correlation. Students receive immediate feedback and have the opportunity to watch a video, get hints,...
Alabama Learning Exchange
Alex: Statistically Thinking
The object of this project is for students to learn how to find univariate and bivariate statistics for sets of data. Also, the students will be able to determine if two sets of data are linearly correlated and to what degree. The...


