Curated OER
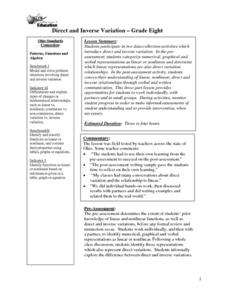
Direct and Inverse Variation
Eighth graders participate in two data collection activities that involve direct and inverse variation. In the pre-assessment, 8th graders categorize numerical, graphical, and verbal representations as linear or nonlinear and determine...
Curated OER
Inverse Variation
In this algebra worksheet, students find the inverse of an equations. They graph their solutions and analyze it. There are 8 questions.
Workforce Solutions
Miniature Gulf Coast Project
Scholars show what they know about data collection and analysis with an activity that examines a smaller population of Houghton, Texas. Independently or in pairs, learners identify their research question, gather, graph, and analyze...
Curated OER
Do the Elephants Need Sunscreen? A Study of the Weather Patterns in Etosha
Students analyze the weather patterns in Namibia. They create a graph of the yearly temperatures and use the internet to gather information. They discuss how the weather goes in cycles in the area.
Curated OER
Linear Piecewise Functions
Students explore the concept of piecewise functions. In this piecewise functions lesson plan, students graph piecewise functions by hand and find the domain and range. Students make tables of values given a piecewise function. Students...
Illustrative Mathematics
Buying Bananas, Assessment Version
Practice with unit rates, proportions, and ratios when Carlos purchases an amount of bananas. Learners must interpret a graph to decide whether points on the same line represent similar proportional relationships. Use with lesson plans...
Curated OER
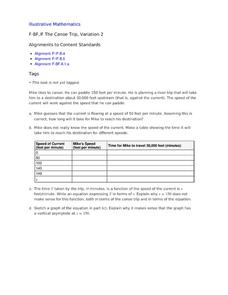
The Canoe Trip, Variation 2
The behavior of a rational function near a vertical asymptote is the focus around this trip up a river. Specifically, numerical and graphical understanding is studied. The canoe context pushes the variables as numbers, rather than as...
University of North Texas
Math Exam 1 Review
Perfect as a review guide, this instructional activity provides a range of questions focusing on functions. Topics include composing functions, transformations, domains, and polynomials. Also included are corresponding worksheets...
Curated OER
Canada's Climate: Temperature and Rainfall Variations
Middle schoolers analyze data about various climates in Canada. In this data analysis and climate lesson, students use Canada Year Book 1999 to complete a worksheet and make connections between precipitation and temperature in different...
Virginia Department of Education
Linear Modeling
An inquiry-based algebra lesson explores real-world applications of linear functions. Scholars investigate four different situations that can be modeled by linear functions, identifying the rate of change, as well as the strength and...
Curated OER
Manatee Awareness Survey
Students examine the public's awareness of manatees by taking a survey. They display the results of the survey as a graph.
Curated OER
Walking Home
Middle schoolers discover the formulas for calculating distance. In groups, they solve equations determine the distance in a specific amount of time. They record their answers in a chart or graph and compare them with their classmates.
Curated OER
Exponential Functions
Analyze functions by their shape and equation and identify decay and growth based on the equation given. Learners graph their exponential functions and differentiate it using the logarithmic versus the exponential function.
Curated OER
Investigating Velocity Effects at Takeoff
Students use, with increasing confidence, problem-solving approaches to investigate and explain mathematical content. They make and test conjectures. They use tables and graphs as tools to interpret expressions, equations, and inequalities.
Curated OER
Calculus Games
In this calculus learning exercise, students rewrite a word problem using algebraic symbols and calculate the derivative of a function to find the correct solution. There are 20 matching questions with an answer key.
Curated OER
Temperature High and Lows
Young scholars gather high and low temperature readings through email. In this temperature graphing activity, students use a spreadsheet to input data for a graph. young scholars interpret the graphs to compare and contrast the data from...
Curated OER
Asthma Survey
Young scholars collect survey data on the prevalence of asthma in a community. They summarize and display the survey data in ways that show meaning.
101 Questions
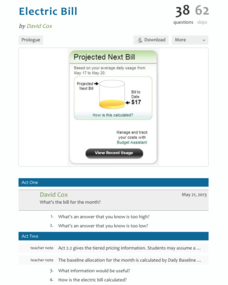
Electric Bill
A brilliant resource is at your disposal. Future consumers investigate and discuss an electric bill. Given only partial information, they estimate the monthly bill. They then consider how tiered pricing will affect the bill.
Curated OER
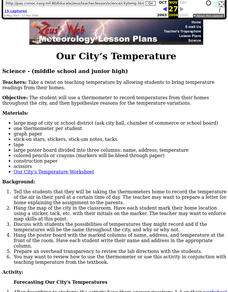
Our City's Temperature
Students use a thermometer to record temperatures from their homes throughout the city, and then hypothesize reasons for the temperature variations. They use a weather graph worksheet that's imbedded in this lesson to orgainize their data.
Curated OER
Stuffed Animals Measuring
Students measure stuffed animals with various materials such as dog biscuits, paper clips, and yarn. In this measurement lesson, students measure the stuffed animals, and understand the concept of long and short and big and little.
Curated OER
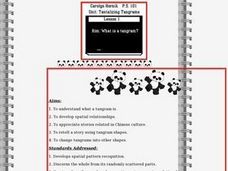
What is a Tangram?
Students identify a tangram. In this geometry lesson, students read Grandfather Tang's Story and retell each story using the tangrams on a flannel board. Students use tangrams to complete an included worksheet.
Curated OER
Picnic Possibilities
Fourth graders plan a picnic using weather data. Using accumulated weather data from various sources, they create a graph of the weather conditions in their region for a given period of time. Students interpret this data to predict the...
Curated OER
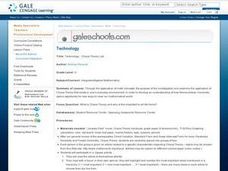
Technology - Chaos Theory Lab
Ninth graders gain an understanding of Chaos Theory that exists in one's everyday environment.
Curated OER
From Playing with Electronics to Data Analysis
Learners collect and Analyze data. In this statistics lesson plan, students identify the line of best fit of the graph. They classify lines as having positive, negative and no correlation.


