Curated OER
Weather
Learners create a spreadsheet and chart using data collected. In this weather lesson, students select five cities from their state, including the city they live in. Learners take daily temperature readings from all five...
Curated OER
Jellybean Graphs
Second graders predict and graph data based on the color of jelly beans they think are in a handful. In this prediction lesson plan, 2nd graders will predict how many of each color jellybean are in a handful. Then they graph these...
Curated OER
Using Computers to Produce Spreadsheets and Bar Graphs
Students review graphing terminology and how to plot data points, how to input data into a spreadsheet, and how to make a chart using a computer.
Curated OER
M & M Madness
Second graders graph M & M's by color. In this graphing lesson plan, 2nd graders first predict how many of each color they think are in a handful of M & M's. Then they graph the amounts of each color on a computer program....
Curated OER
An Introduction to Jan Brett
Students explore the concept of Jan Brett. In this author study lesson, students are introduced to several Jan Brett books with visuals, listening centers, and video. Students browse the internet in search of information...
T. Smith Publishing
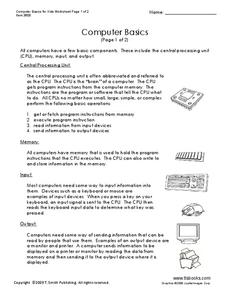
Computer Basics for Kids Worksheet
This informational reading worksheet can be used in your literacy or computer class. Learners learn the basic components of computers then test their knowledge with multiple choice and fill-in-the-blank questions.
Curated OER
Protecting the Environment
Students explain what biodegradable materials are and list examples of them. They design, with online partners' feedback and input, a product made of biodegradable materials and develop a marketing campaign to best sell their product.
Curated OER
Moooooove into Graphing
First graders explore graphing software and create their own graph of farm animals. Then students analyze their graph using the teacher made worksheet which is imbedded in this lesson plan. Great lesson!


