Smithsonian Institution
Vaccines! How Can We Use Science to Help Our Community Make Decisions about Vaccines?
Uncover the fascinating world of vaccines in a multifaceted activity. Investigators explore community perception and the science of vaccines with eight tasks. Scientists continue their studies by giving and reviewing surveys, analyzing...
ESRI
Juneteenth: An American History through Maps
An interactive website traces the history of Juneteenth celebrations from their origin in Galveston, Texas, on June 19th to the present day. Using interactive maps, learners can find information about the African-American population...
Curriculum Corner
Area and Perimeter
Get third graders excited to work find area and perimeter of unit squares, rectangles, and irregular shapes. A 36-page packet comes with task cards, graphic organizers, practice worksheets, printables with squares, exit tickets, and word...
Illustrative Mathematics
Do You Fit In This Car?
A short activity that focuses on the normal distribution as a model for data distribution. Using given means and standard deviations, your budding statisticians can use statistical tables, calculators, or other statistical software to...
Illustrative Mathematics
SAT Scores
If you earned a score of 610 on the math portion of the SAT, what would be your percentile ranking? Given the mean and standard deviation of normally distributed data, find the probability of getting a particular score, or that your...
Illustrative Mathematics
Why Randomize?
Your statisticians draw several samplings from the same data set, some randomized and some not, and consider the distribution of the sample means of the two different types of samplings. The exercise demonstrates that non-random samples...
Curated OER
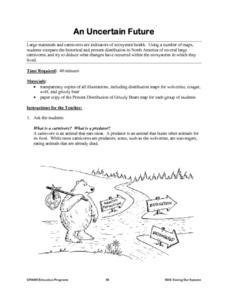
An Uncertain Future
Learners study the distribution of large mammals and carnivores in an ecosystem. Using maps and historical data, they examine areas for these animals such as refuges, untouched forests, prairies and grasslands. Students determine actions...
Curated OER
Application and Modeling of Standard Deviation
The first activity in this resource has learners computing the mean and standard deviation of two different data sets and drawing conclusions based on their results. The second activity has them using a dice-rolling simulation to...
Curated OER
Protecting your home from carbon monoxide
Young scholars create and distribute flyers, mailings, posters in public areas to help make people aware of how to protect yourself from carbon monoxide. Students research what carbon monoxide is and what can be done to protect those in...
Curated OER
Healthy Heart Night
The idea of having a Healthy Heart Night at your school is a fabulous thought. Here are a few ideas that detail was done at one elementary school. It would take a lot of organizing to make it happen, but seems well worth the effort. This...
Curated OER
Using Basic Properties to Solve Problems in Math
Learners identify and define the rules of properties of real numbers. They rewrite each of the problems listed using the commutative or associative properties. Pupils apply problem solving strategies to clarify situations in a table...
Curated OER
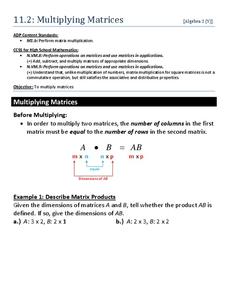
Multiplying Matrices
Go over the basics of matrix multiplication, from checking the dimension of the factors, to applying the distributive property. This worksheet includes directions on when and how to multiply matrices, one example, and a few problems your...
Curated OER
Size It Up: Map Skills
Compare information from a US population cartogram and a standard US map. Learners draw conclusions about population density by analyzing census data a population distribution. They discover that census data is used to apportion seats in...
Curated OER
Graphing Iron Data
Students apply a data set to create a graph show how iron ore impacts an ecosystem. They explain how the iron effects the distribution and abundance of phytoplankton in coastal ecosystems using spreadsheet software.
Curated OER
What's For Dinner?
Eighth graders discover how the location of restaurants affects the future location of different restaurants. Using a fictionous town, they map the locations of all current restaurants and analyze the data to determine what type of...
Curated OER
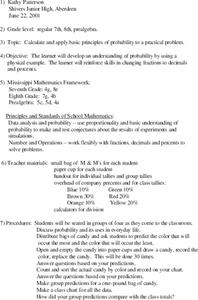
Probability using M & M's
Using M & M's candies, young statisticians predict the color distribution in a packet of candies and test their predictions against their group and the larger class. A review of converting between fractions, decimals, and percents...
Curated OER
Day And Night: Interdisciplinary Study of Cyclic Change
Eighth graders conduct a "Length of Day Symposium." They complete a variety of activities and explorations regarding the earth's rotation, its revolution around the sun and the cyclic changes in climate and energy distribution on the...
Curated OER
Statistics: Standard Deviation and Outliers
In this statistics worksheet, statisticians construct a stem-plot and answer questions regarding the shape of the distribution, standard deviation, and outliers.
Curated OER
Probability and Applications of Simulations
Middle schoolers apply properties of probability to the real world. In this probability instructional activity, learners simulate the construction of empirical distribution. They collect and analyze data using central tendencies.
Illustrative Mathematics
Rectangle Perimeter 3
This activity looks at writing expressions to represent perimeter of a rectangle and then considers the concept of equivalent expressions and the distributive property in more detail.
Teach Engineering
Complex Networks and Graphs
Show your class how engineers use graphs to understand large and complex systems. The resource provides the beginnings of graph theory by introducing the class to set theory, graphs, and degree distributions of a graph.
Curated OER
ENVIRONMENT AND CONSERVATION: JAPAN
Students explain conditions and motivations that contribute to conflict, cooperation, and interdependence among nations; and analyze the causes, consequences and possible solutions to resource allocation, conservation, and economic...
Curated OER
Ingetrated Algebra Practice
In this integrated algebra worksheet, students solve probability problems. They identify the appropriate sample space for the given experiment. This two-page worksheet contains 4 multiple-choice problems. Answers are provided on the...
Curated OER
Looking Normal
Learners identify the shape of a function. For this statistics lesson, students plot the data collected. They analyze their data for positive, negative or no correlation. They find the line of best fit.
Other popular searches
- Distributive Law
- Distributive Property Games
- Distributive Properties
- The Distributive Property
- Model Distributive Property
- The Distributive Property Math
- Distributive Multiplications
- Distributive Law Math
- The Distributive Law
- Algebra Distributive Property
- Algebra Distributive Law
- Distributive Property Math


