West Contra Costa Unified School District
Solving Inequalities
What does translating points on a number line have to do with solving inequalities? Young mathematicians first learn about translations of points on a number line, and then use this information to solve linear inequalities in one variable.
Curated OER
Measure of Spread
Students identify the standard deviation. In this statistics lesson, students find the mean distribution and calculate the percent of deviation from the mean. They observe this change on the Ti calculator.
Curated OER
Sampling Distributions
Students analyze sampling from different population. In this statistics lesson, students define the meaning of sample sizes and what causes an increase or decrease. They graph their data on the Ti calculator and draw conclusion from the...
Curated OER
Basic Algebra and Graphing for Electric Circuits
In this electronics worksheet, students evaluate mathematical expressions to complete 16 short answer and problem solving questions.
Curated OER
Asteroids Between Mars and the Sun
In this asteroids of the solar system worksheet, students observe a diagram showing all the minor planets found in the orbit of Mars. Students answer 4 questions about the minor planets inside the orbit of other planets, they find the...
Curated OER
Give Me A Break!
Students create and conduct a survey. In this broken bones lesson, students discuss if they've ever broken a bone and how a broken bone heals. Students generate questions for a survey on broken bones and healing time, conduct the survey...
Curated OER
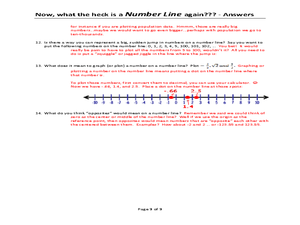
Now, what the heck is a NUMBER LINE again???
A unique approach to reviewing number lines and how to locate different values on them, this instructional activity poses several questions that require written answers rather than calculations. You could use this as a note-taking guide...
Curated OER
Basic Algebra and Computers: Spreadsheets, Charts, and Simple Line Graphs
Students, while in the computer lab, assess how to use Microsoft Excel as a "graphing calculator." They view visual representations of line graphs in a Cartesian plane while incorporating basic skills for using Excel productively.
Curated OER
Number Sense and Operations
In this number sense and operations worksheet, students solve 15 different problems that include number lines and identifying various types of numbers. First, they solve a given equation and then check their work. Then, students find the...
Curated OER
Explore Learning - Mean , Median and Mode Gizmo
Sixth graders experiment with mean, median, and mode. In this online interactive mean, median, and mode lesson plan, 6th graders analyze the results of multiple experiments and after they work in groups completing the median, mode, and...
Curated OER
Chart problems involving car defects and customer service departments
In this interactive instructional activity, students solve two problems using the charts provided. Students must convey they are able to understand charts and how to read them.
Curated OER
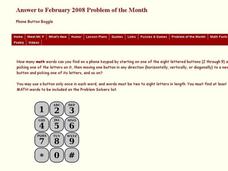
Phone Button Boggle
For this phone button boggle worksheet, students identify the number of math words they can find on a phone keypad according to given directions. This one-page worksheet contains one problem. Answers are provided.
Curated OER
Graphing Parabolas and Circles
Students graph parabolas and circles. For this algebra lesson, students create a table of values and graph the coordinate pairs to create a graph. They graph a circle using the radius and center.
Curated OER
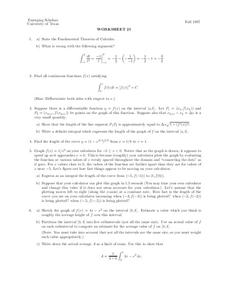
Worksheet 25
In this math worksheet, students state the Fundamental Theorem of Calculus. Then they evaluate the functions and test them against the theorem.
Curated OER
Data and charts
In this data and charts worksheet, students answer multiple choice questions referring to different charts about mountain heights, breakfast drinks, and more. Students complete 10 multiple choice questions.
Curated OER
Exploring Area/Perimeter Through Coordinate Geometry
Students explore area and perimeter through coordinate geometry using student literature, hands-on manipulatives, and the Internet.
Curated OER
Making Connections
Eighth graders investigate the input/output model for building function tables. From the data, 8th graders connect tables, graphs, function rules, and equations in one variable. They work backwards to determine function rules for given...
Curated OER
MA 439-Math of Image Processing
In this image processing worksheet, students use a matrix to solve ten problems. For the first six problems, kids are guided to the answer by carefully sequenced questions. The final four problems require students to make a series of...
Curated OER
Table Readings
In this table instructional activity, students read questions and interpret tables. Questions include information concerning unemployment, oil imports, and foreign students. This multiple-choice instructional activity contains 10...
Curated OER
The Correlation Between Human Population Growth and Dwindling Natural Resources
Eighth graders predict human population growth. In this lesson, 8th graders discuss the length of time needed to double the human population, work in groups to chart population growth and predict population growth in the...
Curated OER
Track's Slippery Slope
Learners graph data of sports figure running time using x-axis y-axis to find slope of trend line, mathematically find the interpolated and extrapolated values for data points. Using the information they make predictions.
Curated OER
Trends in Precipitation
Eighth graders study about precipitation and graph the information. They look for patterns in a scatter graph and make inferences based on what they see. They need to see a relationship between location and the amount of precipitation.


