Curated OER
Usage and Interpretation of Graphs
Cooperative groups are formed for this graphing activity. Each group must construct a graph that represents how many eyelets (the holes for laces in shoes), are present in their group. A whole-class bar graph is eventually constructed...
Curated OER
Circles
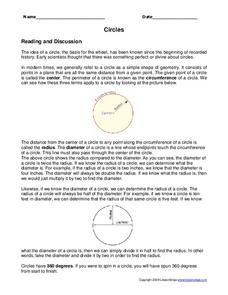
In this circles worksheet, students fill in 6 fill in the blank statements about circles and solve calculate the answers to 13 questions involving different measurements of circles.
Curated OER
Integrated Algebra Practice: Frequency Histograms, Bar Graphs and Tables
In this graphs learning exercise, students solve 4 problems about histograms, bar graphs, and tables. Students answer questions about histograms, bar graphs, and tables.
Curated OER
Triangles
In this triangles worksheet, students solve six word problems where they determine the angles measures in different triangles.
Curated OER
Math Aptitude Test # 3
In this algebra learning exercise, students answer word problems using everyday scenario. The problems are given in a riddle form to make it a brain teaser and grab the students' attention. There are 32 problems to be solved.
Curated OER
Proportion Game
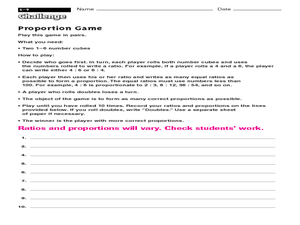
In this proportion game activity, students read the guideline regarding a game pertaining to ratios and play it with a partner.
Curated OER
Fractions in the Kitchen
Seventh graders use the World Wide Web for research, identify fractions found in everyday life by finding a recipe that uses fractions.
Curated OER
Jelly Belly: What a Wonderful "Bean"!
Students explore how jelly beans are produced. They discuss the origins of the jelly bean and view a video about how jelly beans are prepared, tested, shaped, finished, and shipped and estimate the amount of jelly beans in a jar and sort...
Curated OER
Can you Find the Expression
Students collect data from measurements and weights for this experiment. In this algebra lesson plan, students analyze graphs they create form their data to find the expression representing the data. They label which graph provided the...
Curated OER
Worksheet 16 - Spring 1996
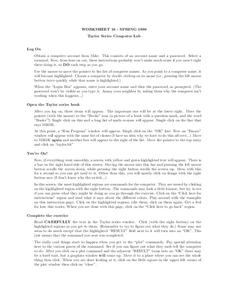
In this math worksheet, students read the instructions for setting up a computer program. Then they practice graphing the functions with the software program.
Curated OER
Childhood Obesity
Students identify a question to generate appropriate data and predict results. They distinguish between a total population and a sample and use a variety of methods to collect and record data. Students create classifications and ranges...
Curated OER
Sum Problem
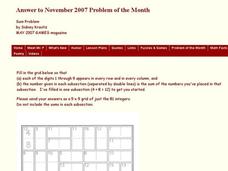
In this algebra worksheet, students solve linear equations by playing a sodoku like game on a 9x9 grid containing 81 integers. They find their answers through addition and summation.
Curated OER
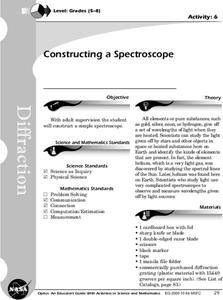
Constructing a Spectroscope
Students construct a simple spectroscope. They observe the emission spectrum produce by a source of light.


