Curated OER
CEENBoT Takes a Dive
Students create a map to scale using technology. In this algebra instructional activity, students navigate through a shipwreck to perform rescues. They use he CEENBoT program to perform the different tasks.
Curated OER
Scale
Learners apply concepts of scales to solve problems. For this geometry lesson, students solve real world problems using scales, proportions and ratios. They predict the actual size of a model given the scale drawings.
Curated OER
The Country of Kenya
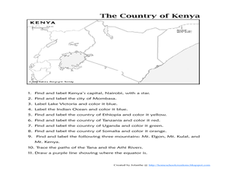
In this map completion worksheet, students observe a map and map scale of Kenya to find and label bodies of water, cities, countries, and the equator. Students answer 11 questions.
Curated OER
Maps/ Scales and Conversions
In this math worksheet, students look for the actual values for the measurements of distance. The answers are found on page three.
EngageNY
Informal Proofs of Properties of Dilations
Challenge the class to prove that the dilation properties always hold. The lesson develops an informal proof of the properties of dilations through a discussion. Two of the proofs are verified with each class member performing the...
Curated OER
Using Venn Diagrams to Compare Two Ecosystems
Students explore the distribution of two ecosystems on a global scale; and map the distribution of tropical and temperate rain forests throughout the world. They use a Venn Diagram to describe these ecosystems and the differences between...
Curated OER
What Is El Niño?
Students access information at remote sites using telecommunications, identify impacts by reviewing past El Ni??o events, make and use scale drawings, maps, and maps symbols to find locations and describe relationships.
Curated OER
Creating a Map
Third graders examine the process of creating an accurate map, and create a map of their playground. They identify what objects are on their playground, and discuss what is found on a map. Students then draw a map of their playground...
Curated OER
New Perspectives
Students examine maps that are designed to give different perspectives. They create mental maps that illustrate their own perspectives and those of people from other parts of the world.
Curated OER
The Middle Ages
Students read books about the Middle Ages. They discuss characteristics of the Middle Ages. In groups, students construct a castle and draw a map to scale. Pupils create a Venn diagram comparing rules in different countries in the...
Curated OER
Unit 19 Scale Drawing
In these scale drawing worksheets, students read the distance problems and select the answer from the choices. Students complete 9 problems.
Curated OER
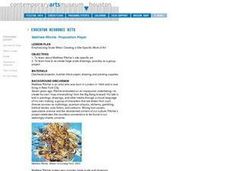
Emphasizing Scale When Creating a Site-Specific Work of Art
Students study art by Matthew Ritchie. Students view pictures of the artist and discuss art that is created specifically for a designated area. Students create pen and ink drawings on letter size paper. Using an overhead, students...
EngageNY
Dilations as Transformations of the Plane
Compare and contrast the four types of transformations through constructions! Individuals are expected to construct the each of the different transformations. Although meant for a review, these examples are excellent for initial...
Inside Mathematics
Swimming Pool
Swimming is more fun with quantities. The short assessment task encompasses finding the volume of a trapezoidal prism using an understanding of quantities. Individuals make a connection to the rate of which the pool is filled with a...
University of Colorado
Are All Asteroids' Surfaces the Same Age?
There are more than 600,000 asteroids in our solar system. Pupils analyze images of two asteroids in order to determine if they are the same age. They count craters for each asteroid and compare numbers.
Teaching Tolerance
Identity Self-Portraits
What symbols represent you best? Individuals consider how they would draw peers using symbols about their identities with an interview and art activity. After conducting interviews and portraits, the art makes a great centerpiece for...
Curated OER
Welina's World
Students living in Hawaii draw a picture of themselves in their neighborhood. They draw their neighborhood in relation to their district and then in relation to the island they are from. They compare their pictures to their classmates'...
Curated OER
Oral Language
Students use distances on a map to draw a route, give directions, and follow directions. In this map lesson plan, students explain their route and directions orally.
Curated OER
Gilligan's Island
Students investigate topographical maps and match actual landforms to them. In this topographical maps lesson students create "Gilligan's Island" to scale then answer questions about it such as what the highest elevations is and...
Curated OER
Home on the Range
Young scholars use maps and mathematics to determine the appropriate panther population in a given area. In this Florida ecology lesson, students research the area requirements of male and female panther and use a map to help calculate...
Curated OER
Message in a Bottle
Sixth graders write a short story about being stranded on a deserted island. After a brief geography review of locations at various latitudes and longitudes, 6th graders draft their story about being stranded. They use sensory and...
Curated OER
Charles Lindberghs's Flight to Paris
Students practice map skills. In this map skills instructional activity, students locate the cities of New York and Paris on a map. Students read about the flight made by Charles Lindbergh in May 1927 from New York to Paris. Students...
Edgate
Great Grids
Learners use grid boxes as a measurement tool and discover how grids are used for mapmaking and scaling down an area. They begin by attempting to draw a model shape drawn by the teacher by using the gridding process. At the conclusion of...
Mathematics Assessment Project
Linear Graphs
A line is a line is a line. As a middle school assessment task, learners first identify graphs of given linear equations. They then identify the equations that represent real-world situations.
