CNN
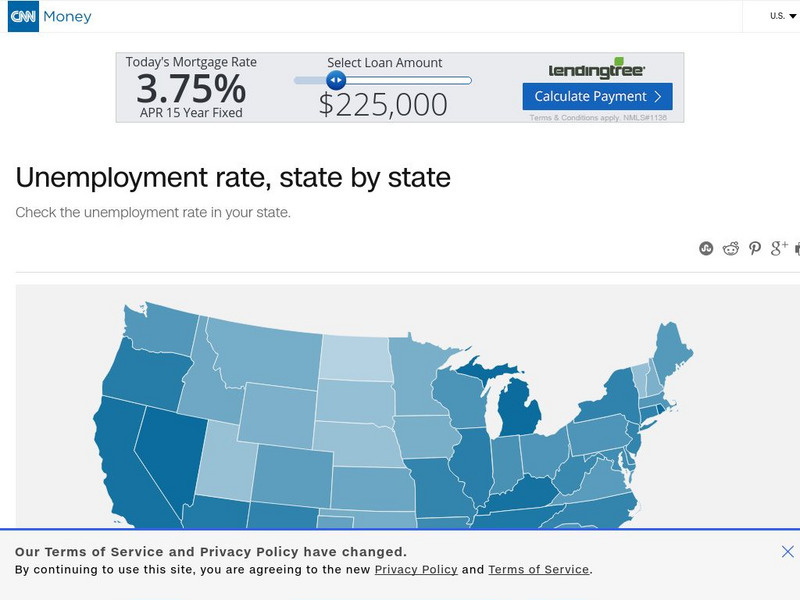
Cnn Money: Unemployment Rate, State by State
Interactive map from CNN showing the current unemployment rate for each state.
Curated OER
Spending and Output Strings
In this classroom activity, "output" cards and "spending" cards are placed on a string. As each increase or decrease, the economy faces more unemployment or inflation. A good visual device to study the relationships among output,...
Curated OER
Spending and Output Strings
In this classroom activity, "output" cards and "spending" cards are placed on a string. As each increase or decrease, the economy faces more unemployment or inflation. A good visual device to study the relationships among output,...
Curated OER
Spending and Output Strings
In this classroom activity, "output" cards and "spending" cards are placed on a string. As each increase or decrease, the economy faces more unemployment or inflation. A good visual device to study the relationships among output,...
Curated OER
Spending and Output Strings
In this classroom activity, "output" cards and "spending" cards are placed on a string. As each increase or decrease, the economy faces more unemployment or inflation. A good visual device to study the relationships among output,...
Curated OER
Spending and Output Strings
In this classroom activity, "output" cards and "spending" cards are placed on a string. As each increase or decrease, the economy faces more unemployment or inflation. A good visual device to study the relationships among output,...
Curated OER
Spending and Output Strings
In this classroom activity, "output" cards and "spending" cards are placed on a string. As each increase or decrease, the economy faces more unemployment or inflation. A good visual device to study the relationships among output,...
Curated OER
Spending and Output Strings
In this classroom activity, "output" cards and "spending" cards are placed on a string. As each increase or decrease, the economy faces more unemployment or inflation. A good visual device to study the relationships among output,...

