PBS
Pbs Learning Media: Global Warming: Graphs Tell the Story
Examine these graphs from the NOVA/ FRONTLINE Web site to see dramatic increases in the temperature of Earth's surface and greenhouse gases in the atmosphere.
US Geological Survey
U.s. Geological Survey: Repeat Photography Project
The Repeat Photography Project pairs historic images with contemporary photos thus documenting glacial decline through photography while communicating the effects of global warming.
Other
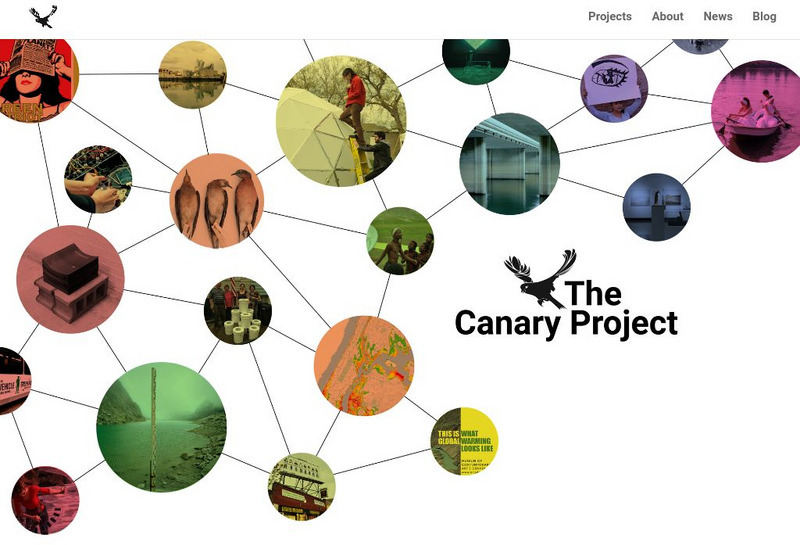
The Canary Project
If you're looking for photographic evidence of global warming, then this is a good resource to check out. Photographs from around the world document the effects of global warming.
PBS
Pbs Learning Media: Co2 Concentrations at Mauna Loa Observatory, Hawaii
This resource, adapted from the Carbon Dioxide Information Analysis Center, provides a graph of monthly average carbon dioxide (CO2) concentration from 1958 to 2000 at the Mauna Loa Observatory in Hawaii.
Other
Interactions Between the Atmosphere & Hydrosphere [Pdf]
A discussion of the interactions between the four spheres of Earth and how they affect weather and climate. The slideshow is divided into two parts. The first deals with interactions between the atmosphere and the hydrosphere and the...
NASA
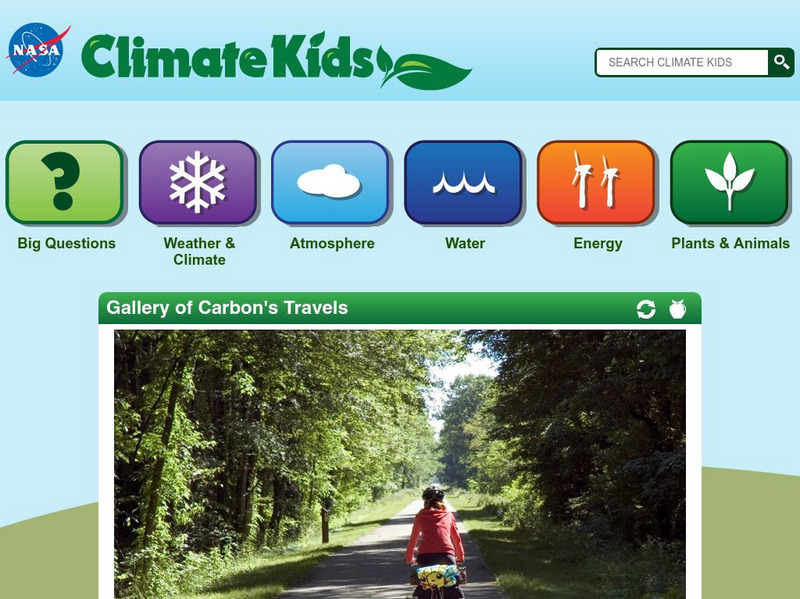
Nasa: Climate Kids: Gallery of Carbon's Travels
A collection of images which shows the effects of too much carbon in our atmosphere There are also some promising carbon-reducing images as well.


