Curated OER
Gender Equity in the Classroom
Students review employment statistics and wages over the past 20 years. They examine the Federal Work Force Laws. They apply formulas to find the rate of change in the minimum wage.
Curated OER
My Test Book: Multiplication Story Problems
In this math skills learning exercise, students solve 10 multiple choice math problems that require them to multiply using decimals. Students may view the correct answers.
PBS
Where Does Your Paycheck Go?
Upper elementary learners explore the concept of taxes taken out of an employee's paycheck. As they work through this lesson, young mathematicians discover the difference between gross pay and net pay. They also see what types of taxes...
Curated OER
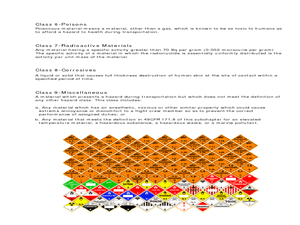
Road Safety - Communication and Understanding What's on Board
Tenth graders apply math formulas to explore the truck driving career. In this math lesson, 10th graders explore websites about road safety and truck driving spills. Students view a PowerPoint about safety placards and exercises.
Curated OER
Careers Using Mathematics
Students role play the role of an employee who is to open a new department for people interested in careers using math. Using the Internet, they research the various types of careers and describe them in a portfolio. They also examine...
Curated OER
Wages, Salaries, and Such
Learners investigate the economics of a job by computing wages based on days, weeks and years. In this vocational lesson, students complete hourly wage worksheets based on employment information. Learners utilize average income data to...
Illustrative Mathematics
The Marble Jar
A jar is filled with 1,500 marbles and customers of a bank can enter a contest to guess the correct percentage of blue marbles. How can an employee at the bank estimate the actual percentage without physically counting all 1,500 marbles?...
Centre for Innovation in Mathematics Teaching
Ten Data Analysis Activities
This thirteen page data analysis worksheet contains a number of interesting problems regarding statistics. The activities cover the concepts of average measurements, standard deviation, box and whisker plots, quartiles, frequency...
Curated OER
Valentine Marbles
if you've ever had to guess how many items were in a jar, then this problem is for you! With a big jar full of red and white marbles, does picking a sample of 16 allow your learners to get a good estimate on the percentages of each...
Visa
Consumer Privacy
The availability of personal financial information is of greater importance now than ever before. Your pupils will discuss how public and private records are accessed by various organizations, particularly considering direct mail, credit...
Mathematics Assessment Project
Suzi's Company
Don't use an average resource ... use this one. As a middle school assessment task, learners first determine mean, median, and mode of salaries given in a frequency table. They then investigate how a change in one value changes the...
101 Questions
Apple Mothership
Explore Apple's spaceship office building. Built in the shape of a circle, the office building offers a unique floor plan challenge. Young scholars use the dimensions of the building to estimate the square footage for each employee.
Curated OER
Educational Skills/Career Skills
How can you help first graders be aware of the relationship between work and learning? By having them think of five jobs that use math, reading, and writing you will help them understand the need for an education. Each job will be...
Curated OER
Building our Rainforest
Learners apply their math and measuring skills to create "tree trunk" panels for their tropical rain forest. They use their recorded information to construct strips of paper that are correct height.
National Woman's History Museum
Getting with the Program
A seven-step lesson introduces the emergence of computer sciences and the contributions women made to the profession after World War II. Several science experiments offer pupils a hands-on learning experience that showcases parabolas,...
Curated OER
Generate Measurement Data Word Problems
Bar and line graphs are an excellent way to visually analyze data: give your scholars practice both analyzing graphs and creating their own! First, they examine five basic bar graphs, indicating the number of squares on specific days....
Curated OER
Lesson 10 What is an Initial Public Offering (IPO)?
Students understand the difference between primary and secondary stock markets. Through the activities in this lesson plan, students predict the next best time to invest in IPOs for the Global Stock Game.
Curated OER
Frequency Distributions
In this statistics worksheet, students solve 5 frequency problems. In four of the problems, the frequency table is provided and students construct one relative frequency table, one cumulative frequency table, and two cumulative relative...
Curated OER
Career Connections: The Connection Corner
Students will create a career information center. In this careers instructional activity, students research careers on a local and national level and create a help wanted ad for an occupation of personal interest. Students create a...
Balanced Assessment
Survey Says
Examine statistical data that shows an overlap in responses. The data tallies over 100% and learners interpret this data characteristic. They then create a graph to represent the data.
Curated OER
Getting Into Shapes: Identifying and Describing Two-Dimensional Shapes
Young scholars examine their classroom to find examples of various types of shapes. After identifying and describing the various shapes, they draw as many as they can on a piece of paper. They organize them into an image based on their...
Curated OER
Numbers Scavenger Hunt
Students use computers and Internet to research specified topics using given sites. They print the researched information, and create a PowerPoint presentation.
Curated OER
Classifying Lesson Plan
Students classify objects according to their similar characteristics.
Curated OER
Budgeting for the Future
Eighth graders determine the net amount of an income for a fictional job. They must determine their net worth minus standard deductions. Students must then determine their monthly budget including, groceries, credit, and rent.


