Hi, what do you want to do?
NOAA
Noaa: Estuaries: Noaa: Science Data: Graphing
Create graphs of marine ecosystems using real-time data.
Science Education Resource Center at Carleton College
Serc: Introduction to Texas Hurricanes
In this activity, students are asked to graph data about some 20th century hurricanes that hit the Texas coastline. For each graph, they are asked several questions about any apparent correlation between the different variables. Students...
Other
A River Runs Through It Learning Project
In this year long learning project integrating mathematics and science, students solve environmental problems using data collection and problem solving concepts. Designed for upper elementary gifted students. Interactive components and...
Science Education Resource Center at Carleton College
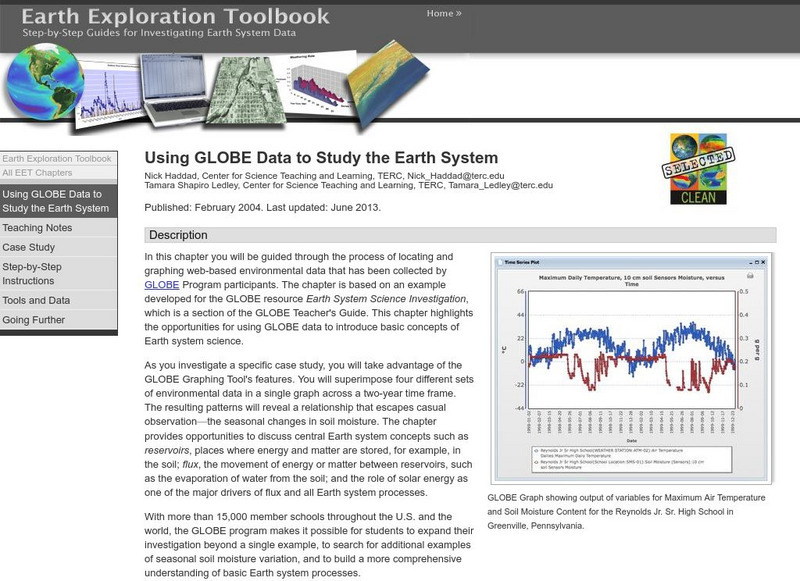
Serc: Using Globe Data to Study the Earth System
This lesson guides students through the process of locating and graphing web-based environmental data that has been collected by GLOBE Program participants. The lesson provides opportunities for using GLOBE data to introduce basic...
TeachEngineering
Teach Engineering: Engineering for the Earth
Young students are introduced to the complex systems of the Earth through numerous lessons on its natural resources, processes, weather, climate and landforms. Key earth science topics include rocks, soils and minerals, water and natural...


